. 2014 Jun 10;111(23):8619-24.
doi: 10.1073/pnas.1403112111. Epub 2014 May 8.

Performance-optimized hierarchical models predict neural responses in higher visual cortex

Affiliations

Performance-optimized hierarchical models predict neural responses in higher visual cortex

Daniel L K Yamins et al. Proc Natl Acad Sci U S A. .

Abstract

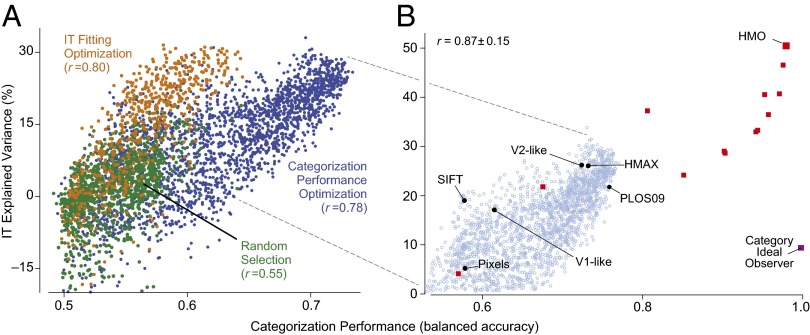
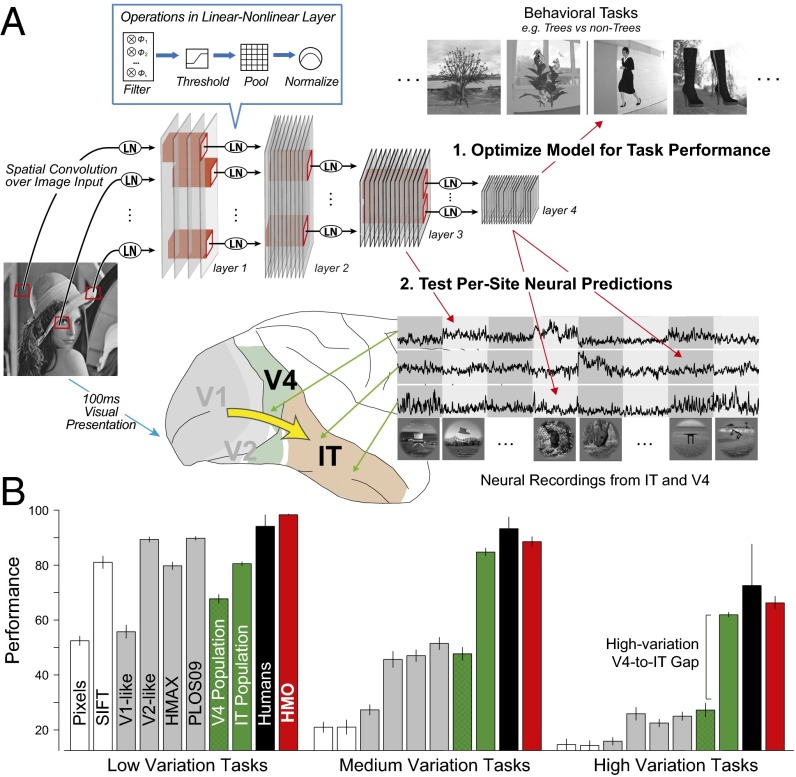
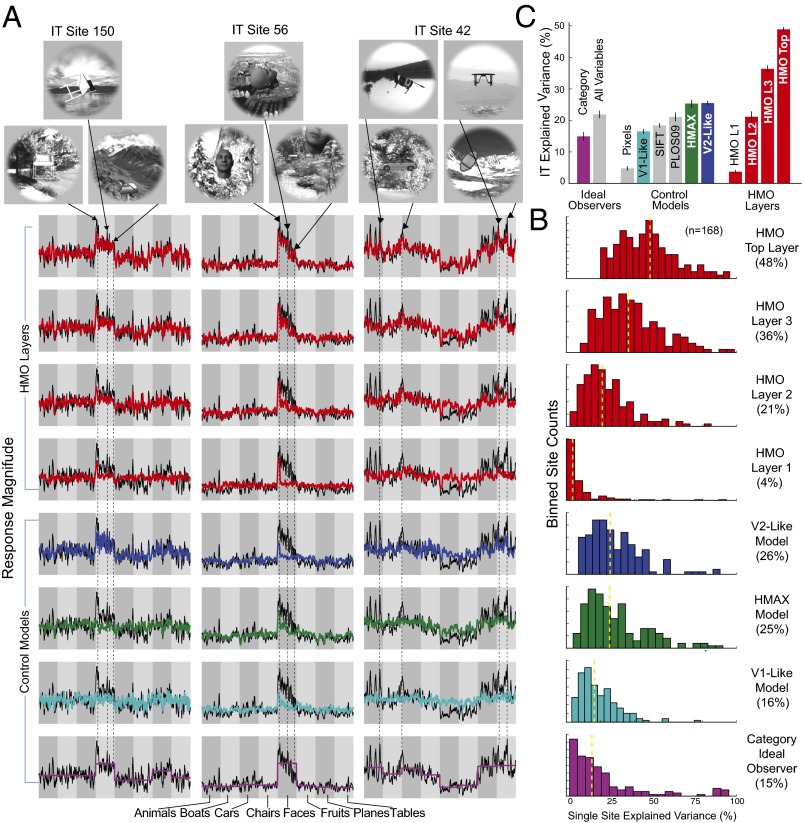
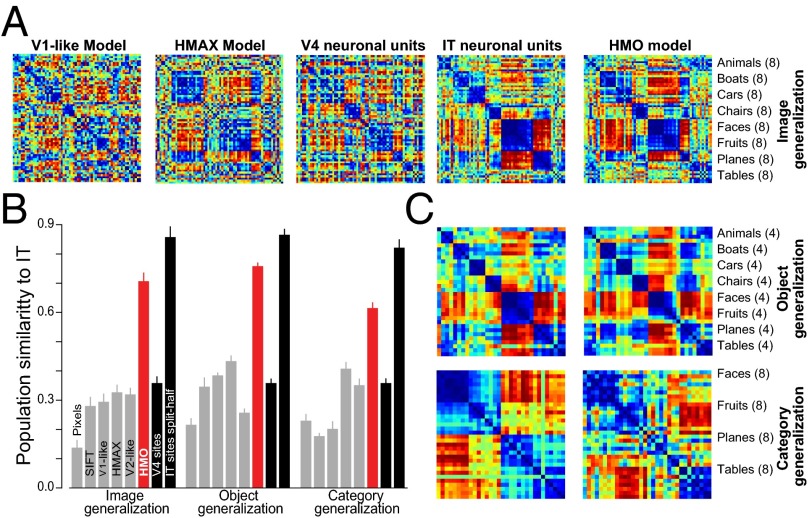
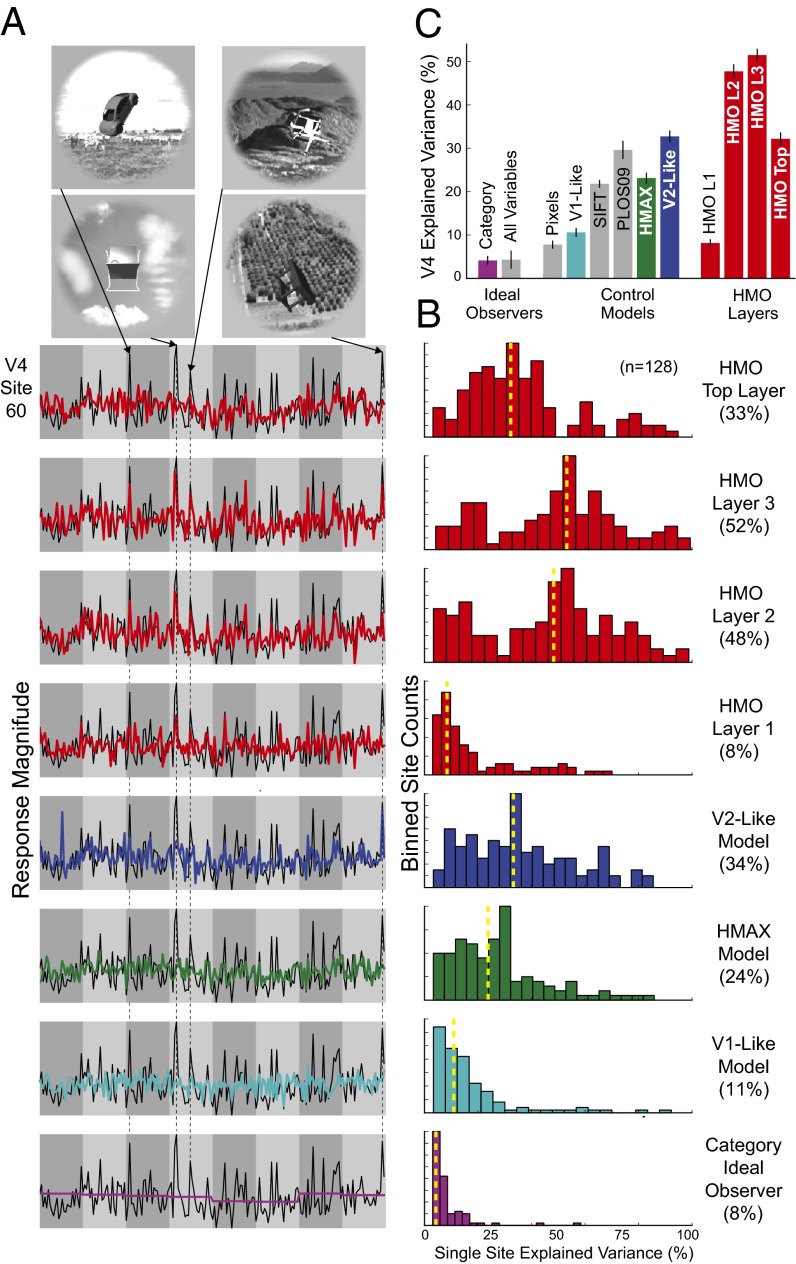
The ventral visual stream underlies key human visual object recognition abilities. However, neural encoding in the higher areas of the ventral stream remains poorly understood. Here, we describe a modeling approach that yields a quantitatively accurate model of inferior temporal (IT) cortex, the highest ventral cortical area. Using high-throughput computational techniques, we discovered that, within a class of biologically plausible hierarchical neural network models, there is a strong correlation between a model's categorization performance and its ability to predict individual IT neural unit response data. To pursue this idea, we then identified a high-performing neural network that matches human performance on a range of recognition tasks. Critically, even though we did not constrain this model to match neural data, its top output layer turns out to be highly predictive of IT spiking responses to complex naturalistic images at both the single site and population levels. Moreover, the model's intermediate layers are highly predictive of neural responses in the V4 cortex, a midlevel visual area that provides the dominant cortical input to IT. These results show that performance optimization--applied in a biologically appropriate model class--can be used to build quantitative predictive models of neural processing.

Keywords: array electrophysiology; computational neuroscience; computer vision.


Conflict of interest statement

The authors declare no conflict of interest.

Figures

Fig. 1.
Fig. 1.
Performance/IT-predictivity correlation. (A) Object categorization performance vs. IT neural explained variance percentage (IT-predictivity) for CNN models in three independent high-throughput computational experiments (each point is a distinct neural network architecture). The x axis shows performance (balanced accuracy, chance is 0.5) of the model output features on a high-variation categorization task; the y axis shows the median single site IT explained variance percentage (n=168 sites) of that model. Each dot corresponds to a distinct model selected from a large family of convolutional neural network architectures. Models were selected by random draws from parameter space (green dots), object categorization performance-optimization (blue dots), or explicit IT predictivity optimization (orange dots). (B) Pursuing the correlation identified in A, a high-performing neural network was identified that matches human performance on a range of recognition tasks, the HMO model. The object categorization performance vs. IT neural predictivity correlation extends across a variety of models exhibiting a wide range of performance levels. Black circles include controls and published models; red squares are models produced during the HMO optimization procedure. The category ideal observer (purple square) lies significantly off the main trend, but is not an actual image-computable model. The r value is computed over red and black points. For reference, light blue circles indicate performance optimized models (blue dots) from A.
Fig. 2.
Fig. 2.
Neural-like models via performance optimization. (A) We (1) used high-throughput computational methods to optimize the parameters of a hierarchical CNN with linear-nonlinear (LN) layers for performance on a challenging invariant object recognition task. Using new test images distinct from those used to optimize the model, we then (2) compared output of each of the model’s layers to IT neural responses and the output of intermediate layers to V4 neural responses. To obtain neural data for comparison, we used chronically implanted multielectrode arrays to record the responses of multiunit sites in IT and V4, obtaining the mean visually evoked response of each of 296 neural sites to ∼6,000 complex images. (B) Object categorization performance results on the test images for eight-way object categorization at three increasing levels of object view variation (y axis units are 8-way categorization percent-correct, chance is 12.5%). IT (green bars) and V4 (hatched green bars) neural responses, and computational models (gray and red bars) were collected on the same image set and used to train support vector machine (SVM) linear classifiers from which population performance accuracy was evaluated. Error bars are computed over train/test image splits. Human subject responses on the same tasks were collected via psychophysics experiments (black bars); error bars are due to intersubject variation.
Fig. 3.
Fig. 3.
IT neural predictions. (A) Actual neural response (black trace) vs. model predictions (colored trace) for three individual IT neural sites. The x axis in each plot shows 1,600 test images sorted first by category identity and then by variation amount, with more drastic image transformations toward the right within each category block. The y axis represents the prediction/response magnitude of the neural site for each test image (those not used to fit the model). Two of the units show selectivity for specific classes of objects, namely chairs (Left) and faces (Center), whereas the third (Right) exhibits a wider variety of image preferences. The four top rows show neural predictions using the visual feature set (i.e., units sampled) from each of the four layers of the HMO model, whereas the lower rows show the those of control models. (B) Distributions of model explained variance percentage, over the population of all measured IT sites (n = 168). Yellow dotted line indicates distribution median. (C) Comparison of IT neural explained variance percentage for various models. Bar height shows median explained variance, taken over all predicted IT units. Error bars are computed over image splits. Colored bars are those shown in A and B, whereas gray bars are additional comparisons.
Fig. 4.
Fig. 4.
Population-level similarity. (A) Object-level representation dissimilarity matrices (RDMs) visualized via rank-normalized color plots (blue = 0th distance percentile, red = 100th percentile). (B) IT population and the HMO-based IT model population, for image, object, and category generalizations (SI Text). (C) Quantification of model population representation similarity to IT. Bar height indicates the spearman correlation value of a given model’s RDM to the RDM for the IT neural population. The IT bar represents the Spearman-Brown corrected consistency of the IT RDM for split-halves over the IT units, establishing a noise-limited upper bound. Error bars are taken over cross-validated regression splits in the case of models and over image and unit splits in the case of neural data.
Fig. 5.
Fig. 5.
V4 neural predictions. (A) Actual vs. predicted response magnitudes for a typical V4 site. V4 sites are highly visually driven, but unlike IT sites show very little categorical preference, manifesting in more abrupt changes in the image-by-image plots shown here. Red highlight indicates the best-matching model (viz., HMO layer 3). (B) Distributions of explained variances percentage for each model, over the population of all measured V4 sites (n=128). (C) Comparison of V4 neural explained variance percentage for various models. Conventions follow those used in Fig. 3.

Comment in

References

    1. DiCarlo JJ, Cox DD. Untangling invariant object recognition. Trends Cogn Sci. 2007;11(8):333–341. - PubMed
    1. Grill-Spector K, Kourtzi Z, Kanwisher N. The lateral occipital complex and its role in object recognition. Vision Res. 2001;41(10-11):1409–1422. - PubMed
    1. Malach R, Levy I, Hasson U. The topography of high-order human object areas. Trends Cogn Sci. 2002;6(4):176–184. - PubMed
    1. Kriegeskorte N, et al. Matching categorical object representations in inferior temporal cortex of man and monkey. Neuron. 2008;60(6):1126–1141. - PMC - PubMed
    1. Tanaka K. Inferotemporal cortex and object vision. Annu Rev Neurosci. 1996;19:109–139. - PubMed

Publication types