. 2014 Jul;137(Pt 7):1931-44.
doi: 10.1093/brain/awu115. Epub 2014 May 8.

Predicting and correcting ataxia using a model of cerebellar function

Affiliations

Predicting and correcting ataxia using a model of cerebellar function

Nasir H Bhanpuri et al. Brain. 2014 Jul.

Abstract

Cerebellar damage results in uncoordinated, variable and dysmetric movements known as ataxia. Here we show that we can reliably model single-joint reaching trajectories of patients (n = 10), reproduce patient-like deficits in the behaviour of controls (n = 11), and apply patient-specific compensations that improve reaching accuracy (P < 0.02). Our approach was motivated by the theory that the cerebellum is essential for updating and/or storing an internal dynamic model that relates motor commands to changes in body state (e.g. arm position and velocity). We hypothesized that cerebellar damage causes a mismatch between the brain's modelled dynamics and the actual body dynamics, resulting in ataxia. We used both behavioural and computational approaches to demonstrate that specific cerebellar patient deficits result from biased internal models. Our results strongly support the idea that an intact cerebellum is critical for maintaining accurate internal models of dynamics. Importantly, we demonstrate how subject-specific compensation can improve movement in cerebellar patients, who are notoriously unresponsive to treatment.

Keywords: ataxia; cerebellum; computational model; dysmetria; internal model.


Figures

Figure 1
Figure 1
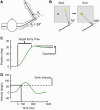
Task overview and explanation of metrics. (A) Overhead view of a right-handed subject arm (measurements from left-handed individuals were reflected across the midline). Throughout all tasks, the shoulder angle (θs) was fixed at 30° flexion by mechanically clamping the robot arm. Elbow angle (θe) was measured as the angle between the upper arm and forearm in the direction of flexion. (B) Subjects saw a white dot (0.25-cm radius) over their index finger during the entire experiment but were unable to see their arm due to a metal screen. At the start of each trial, subjects held the start target (yellow, 0.4-cm radius) at an elbow angle of 75° and were instructed to make fast, accurate movements to the end target (purple, 0.4-cm radius) located 30° away (θe = 105°). Note visual targets are enlarged for illustrative purposes. (C) Position profile for an example hypermetric movement. Dysmetria was calculated as the difference between the final position and the position at the time of first correction (time of first correction: the time where the velocity or acceleration crossed thresholds of 2°/s or −2°/s2). Target entry time was computed by subtracting the time at which the fingertip first exited the start target from the time at which the fingertip first entered the end target. (D) Velocity profile for the same movement depicted in (C). Early velocity was the velocity 150 ms after movement onset (movement onset: the first time when the velocity exceeded 10°/s for five consecutive milliseconds). See also Supplementary Table 1.
Figure 2
Figure 2
Comparison of controls and patients during null field reaches. (A–C) Position traces of three subjects making 30° elbow flexion movements. (A) Movements of a typical control subject were smooth, accurate and exhibited low variability across trials. (B) Some patients showed a tendency to overshoot the target (hypermetric). (C) Other patients showed a tendency to undershoot the target (hypometric). Individual trials are aligned by maximum velocity and color-coded by the extent of dysmetria according to the colour bar. The average of the kinematics (black, solid) and the target (grey, dashed) are also shown. (D) Dysmetria versus early velocity for controls (normal: light blue open vertical rectangles; duration-matched: light blue filled vertical rectangles) and patients (brown symbols; horizontal rectangles, circles, diamonds, triangles). These metrics were negatively correlated among the patient group (R = −0.785, P = 0.007) but not the control group. The shaded region indicates the average dysmetria ± 1 SE (standard error) for the duration-matched controls.
Figure 3
Figure 3
Irregular trajectories of control subjects are predicted by the computational model. (A) Position traces of average reaches in null and perturbation conditions for a typical control subject. Shaded regions indicate standard deviation. (B) Model output of different conditions for same subject shown in A. Thin arrows indicate time of peak acceleration and thick arrows indicate time of peak deceleration. (C) Control group (n = 11) averages of dysmetria difference and early velocity difference for reaches (round symbols) in the various conditions. Dysmetria difference and early velocity difference were computed for each subject as the average dysmetria and early velocity values of each condition minus the average dysmetria and early velocity values of the null condition. All conditions resulted in significant differences from null in both metrics (all P < 0.005) except for dysmetria difference in the increased damping (+b) condition (P > 0.27). Model output was computed for each subject and then averaged for each condition (diamond symbols). Error bars indicate standard deviation. Note the inertial perturbations (green long dash and blue short dash) have a similar pattern to the patient reaches in the null condition (Fig. 2D, brown symbols; horizontal rectangles).
Figure 4
Figure 4
Block diagram of the computational model of reaching control. The blocks represent computations that could be done by the brain as well as physical dynamics. Lines are the signals (torques and kinematics) sent from one brain region to another or signals going to/returning from the periphery. The model consists of several computations. First, a desired trajectory (Goal) is computed with the following requirements: it must have a bell-shaped velocity profile, cause a positional change of 30°, and last a specified duration. Second, the trajectory information is sent to an internal inverse dynamic model (Command Generator) that contains the internal model estimates of inertia and damping. In the Supplementary material, there is information about how a similar computational model could be constructed with a forward dynamic model and feedforward gain as the command generator (Supplementary Fig. 1). For a given desired trajectory and internal model, the appropriate torque at each time point can be computed to match the desired trajectory. Third, the dynamic model of the arm and robot (Plant) translates the torque to changes in the kinematics (i.e. position, velocity and acceleration) of the plant. When the internal model of the command generator perfectly matches the dynamics of the plant, then the desired trajectory is perfectly achieved and there is no error. However, if the internal model values are biased and do not match the values of the plant, the plant will deviate from the desired trajectory. Fourth, sensory feedback (Sensory System) relays the actual changes in the plant, which are compared to the desired trajectory, to compute errors. These errors are multiplied by the feedback error gains (KFB) to provide on-line corrections. u = motor command; t = time step; FF = feedforward; FB = feedback; pos. = position; vel. = velocity; Δ = delay. This model framework was used for simulations shown in Figs 3 and 5, and Supplementary Figs 4 and 5. See the Supplementary material for more details.
Figure 5
Figure 5
Patient dysmetria is modelled as internal model inertial bias. (A and B) Comparison of average patient null movements (orange, solid) to best model fit (green, dotted) for the same (A) hypermetric patient and (B) hypometric patient shown in Fig. 2B and C. Thin arrows indicate time of peak acceleration and thick arrows indicate time of peak deceleration. (C) The internal model inertia bias determined by the computational model was highly correlated with dysmetria (R = 0.887, P = 0.0006). (D) The i&b-fit was best during the fit period, but the i-fit was comparable to the i&b-fit during the predicted period, suggesting that i bias alone can account for much of the observed behaviour. i = inertia compensation; b = damping compensation; i&b = simultaneous inertia and damping compensation. *P < 0.05, **P < 0.01. See also Supplementary Fig. 2. IM = internal model; PL = plant.
Figure 6
Figure 6
Patient dysmetria is reduced by modifying arm inertia. (A and B) Results from hypermetric patients, individual and group data. Decreasing arm inertia (A) reduced overshoot (P < 0.003) and (B) increased early velocity (P < 0.04) of hypermetric patients. (C and D) Results from hypometric patients. Increasing arm inertia (C) reduced undershoot (P < 0.02) and (D) decreased early velocity (P < 0.07) of hypometric patients. The variability (black error bars indicate standard deviation) was similar with or without inertial compensation. Brown markers, left of the tick marks, indicate baseline performance (individual subjects and means), and blue and green markers, right of the tick marks, show performance with increased and decreased inertia perturbation (individual subjects and group means). Shaded regions indicate the duration-matched control average ± 1 standard error. SE = standard error; i = inertia; PL = plant; IM = internal model. *P < 0.05, **P < 0.01. See also Supplementary Fig. 3.
Figure 7
Figure 7
Patients are more variable than controls and have persistent biases. (A) The group average of variance of dysmetria was higher for patients (P < 0.01) than controls in the null condition (Null). In addition, variance of dysmetria in the inertia compensation condition (Comp) was higher than controls (P < 0.01). See also Supplementary Fig. 5 for simulations of variability. (B) Patient dysmetria is similar within a 6–24 month period. Three patients were retested 6–24 months after their initial visit and average dysmetria did not change significantly with the passage of time. (C) Schematic of presumed internal model distributions of inertia for the three classes of subjects: controls (teal, solid), hypermetric patients (dark red, long dash) and hypometric patients (purple, short dash). Internal model estimates of patients are thought to be biased and more variable compared to controls. **P < 0.01. IM = internal model; PL = plant.

References

    1. Angel RW. Barognosis in a patient with hemiataxia. Ann Neurol. 1980;7:73–7. - PubMed
    1. Bastian AJ. Learning to predict the future: the cerebellum adapts feedforward movement control. Curr Opin Neurobiol. 2006;16:645–9. - PubMed
    1. Bastian AJ, Martin TA, Keating JG, Thach WT. Cerebellar ataxia: abnormal control of interaction torques across multiple joints. J Neurophysiol. 1996;76:492–509. - PubMed
    1. Bastian AJ, Zackowski KM, Thach WT. Cerebellar ataxia: torque deficiency or torque mismatch between joints? J Neurophysiol. 2000;83:3019–30. - PubMed
    1. Bhanpuri NH, Okamura AM, Bastian AJ. Active force perception depends on cerebellar function. J Neurophysiol. 2012;107:1612–20. - PMC - PubMed

Publication types