. 2014 May 9;344(6184):626-30.
doi: 10.1126/science.1250444.

Spatially distributed local fields in the hippocampus encode rat position

Affiliations

Spatially distributed local fields in the hippocampus encode rat position

Gautam Agarwal et al. Science. .

Abstract

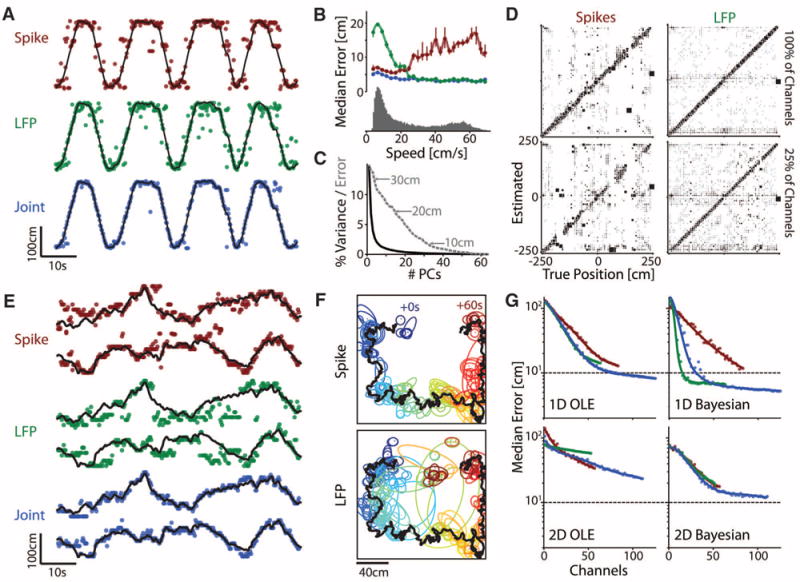
Although neuronal spikes can be readily detected from extracellular recordings, synaptic and subthreshold activity remains undifferentiated within the local field potential (LFP). In the hippocampus, neurons discharge selectively when the rat is at certain locations, while LFPs at single anatomical sites exhibit no such place-tuning. Nonetheless, because the representation of position is sparse and distributed, we hypothesized that spatial information can be recovered from multiple-site LFP recordings. Using high-density sampling of LFP and computational methods, we show that the spatiotemporal structure of the theta rhythm can encode position as robustly as neuronal spiking populations. Because our approach exploits the rhythmicity and sparse structure of neural activity, features found in many brain regions, it is useful as a general tool for discovering distributed LFP codes.


Figures

Fig. 1
Fig. 1. Recording space- and time-dependent variations in theta rhythm
(Ai) Arrangement of 64 (yellow) and 2 by 256 (red) electrode arrays implanted in the hippocampi of different rats. Left and right panels depict recordings along orthogonal axes: D/V, dorsoventral; A/P, anteroposterior; M/L, mediolateral. (Aii) Average spatial distribution of theta recorded by the electrode array in the right panel of (Ai) reveals systematic differences in the anatomical distribution of the theta rhythm. Arrows depict local phase gradients. (B) A rat runs across a 250-cm track to receive a water reward (w) at both ends. (C to E) (Left) LFP recorded during one run across the track. (Right) schematic of signal representation. Axes: T, time; R, real; I, imaginary. (C) Velocity of the rat (top) and the original, broadband signal (bottom), which shows a strong theta rhythm during running. (D) (Top) Filtering the signal with Morlet wavelet (5 to 11 Hz half-power cutoff) results in a complex-valued waveform with time-varying amplitude and phase. (Bottom) The first principal component (PC1) of the complex-valued signal, which tracks the global theta oscillation. (E) Demodulating the signal using PC1 as a carrier identifies modulations in amplitude and phase. (F) Averaging the demodulated signal over multiple runs reveals that its variations depend systematically on the rat’s position. For (E) and (F), phase is scaled by a factor of 16 to emphasize time-varying structure.
Fig. 2
Fig. 2. Decoding of position by demodulated LFP and spikes
(A) Decoding of rat position on a linear track by LFP and spikes. Lines indicate actual trajectory, while dots indicate OLE estimate of position (y axis) at each time point (x axis). (B) LFP-based decoder performs best at high velocities, unlike spike-based decoder. The lower histogram shows the time spent at different speeds. (C) Variance is largely explained by PC1 (~85% of total variance, falling outside of plotted range), and accurate, cross-validated decoding depends on a large number of PC dimensions. (D) Histogram of decoder predictions; dark squares indicate high-probability events. Decoders trained on subsets of LFP channels (right) degrade uniformly, whereas those trained on spikes from subsets of neurons (left) degrade in a patchy manner. (E) Decoding of rat position in a 2D open field using a Bayesian filter-based decoder. Lines indicate actual trajectory in x and y coordinates; dots indicate decoder estimates. (F) Bird’s eye view of actual (black) and estimated (color) position at different time points. Ellipses indicate ~1 SD confidence regions. (G) Median error of decoders as a function of the number of (random) channels used. Data is from rat ec014, with 64 electrodes straddling the cornu ammonis 1 (CA1) pyramidal layer. Identical color codes are used for (A), (B), (E), and (G).
Fig. 3
Fig. 3. Sparse decompositions of oscillatory features in multielectrode data
(A) ICA of the signal reveals components, termed FFPs, that activate selectively at particular locations. (B) Each FFP exhibits a unique phase-amplitude relationship across the recorded area. For display purposes, FFPs are mean-subtracted to reveal differences (see supplementary materials). (C) Sparse decomposition of the broadband signal (4 to 80 Hz) reveals components that activate at corresponding locations and have distinctive broadband structure, consisting of diverse onsets and peaks. Individual traces are colored according to their corresponding electrodes in (B). (D) Broadband sparse components activate sequentially on the track, also exhibiting theta periodicity; components that activate in the reverse direction (black lines) remain silent. (Inset) Mean power spectrum of component activations. Data was recorded by a 64-electrode array implanted in CA1.
Fig. 4
Fig. 4. Population properties of FFPs and neuronal spikes during a single session
(A) FFPs uniformly tile the length of the track. The spatial extent and spacing of different FFPs is largely homogeneous across the track (middle). FFPs exhibit phase precession with respect to PC1 (bottom). (B) Pyramidal cells have place fields that are more variable in extent and distribution. (C) The overlap of FFP activations is largely restricted to neighbors, unlike that for pyramidal cells [grayscale range of P(Overlap) = 0 to 0.1]. (D) Activation of FFPs in a T maze. Waiting area is enclosed in a red box. Right panels show close-up of activations in waiting area, separated by direction of entry. Asterisks mark activations that are entry-direction selective. Each point represents a time bin where FFP activation exceeds a threshold, its size indicating the magnitude of activation. In (A) and (B), place-field hues are assigned based on location of maximal activation; in (D), hues are assigned to distinguish neighbors. Data for (A), (B), and (C) are collected by a 64-electrode array; (D) was from 2- by 256-electrode arrays.

References

    1. Wilson MA, McNaughton BL. Science. 1993;261:1055–1058. - PubMed
    1. Freeman WJ. Clin Neurophysiol. 2004;115:2077–2088. - PubMed
    1. Buzsáki G, Anastassiou CA, Koch C. Nat Rev Neurosci. 2012;13:407–420. - PMC - PubMed
    1. Łęski S, Lindén H, Tetzlaff T, Pettersen KH, Einevoll GT. PLOS Comput Biol. 2013;9:e1003137. - PMC - PubMed
    1. Logothetis NK. J Neurosci. 2003;23:3963–3971. - PMC - PubMed

Publication types