

doi: 10.1111/j.1728-4457.2013.00557.x.
Fertility Transition: Is sub-Saharan Africa Different?
- PMID: 24812439
- PMCID: PMC4011385
- DOI: 10.1111/j.1728-4457.2013.00557.x
Item in Clipboard
Fertility Transition: Is sub-Saharan Africa Different?
Popul Dev Rev.
2013 Feb.
No abstract available
Figures
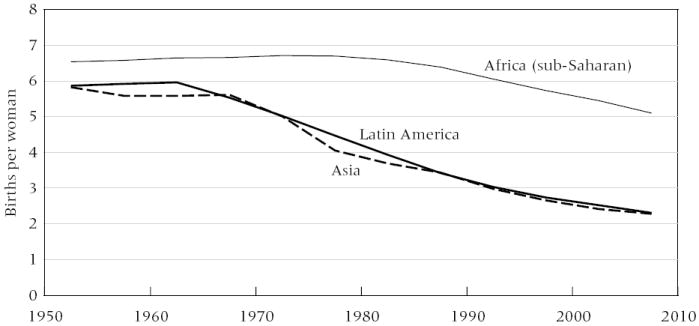
SOURCE: United Nations 2011.
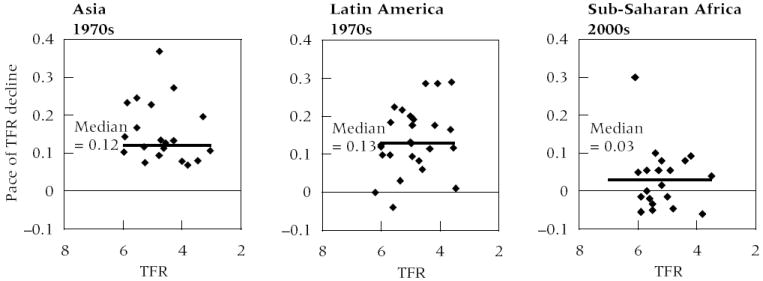
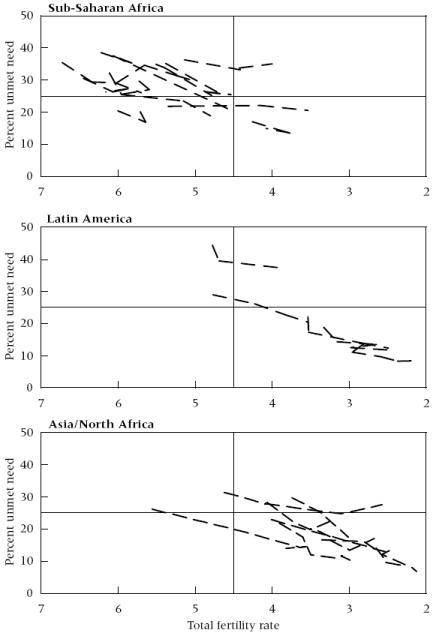
SOURCES: United Nations 2011; DHS surveys.
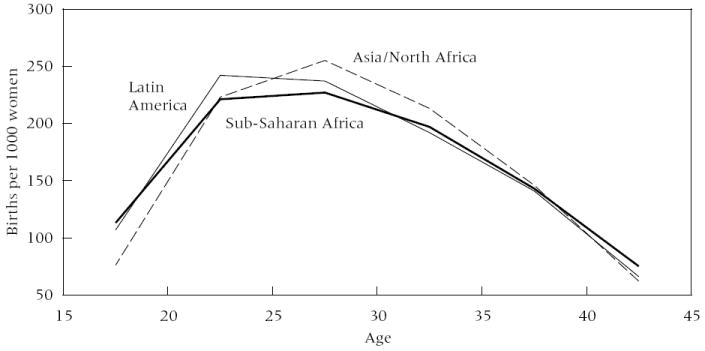
NOTE: Sample is one survey per country, TFR closest to 5.0. Age-specific rates adjusted to sum to TFR = 5.0. n = 38 countries.
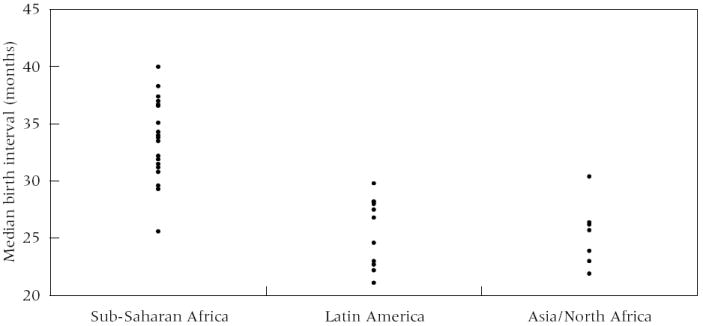
NOTE: Median length of preceding interval for all births in months 0–59 before survey. n = 38 countries.
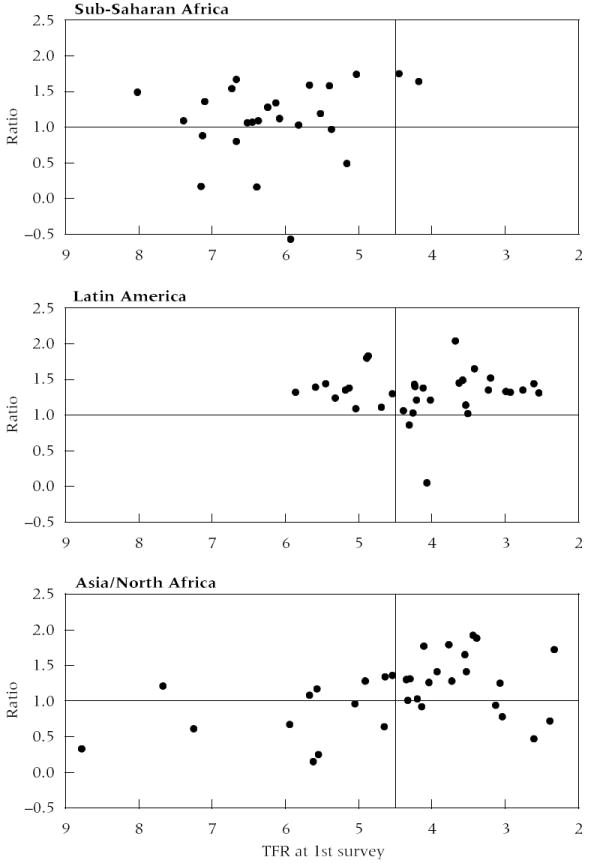
NOTE: n = 49 countries and 92 inter-survey periods; minimum TFR decline = 0.4 births; minimum inter-survey period = 4 years.
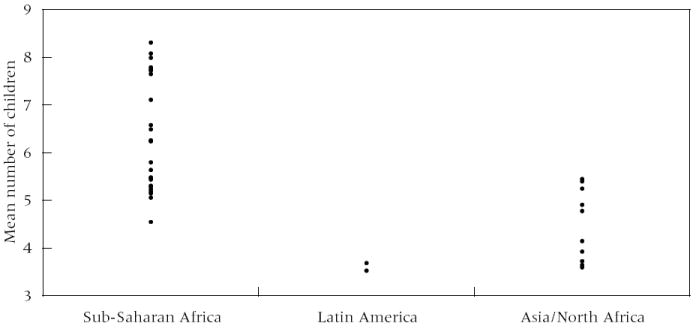
NOTE: Earliest survey, TFR >5.5. n = 37 countries.
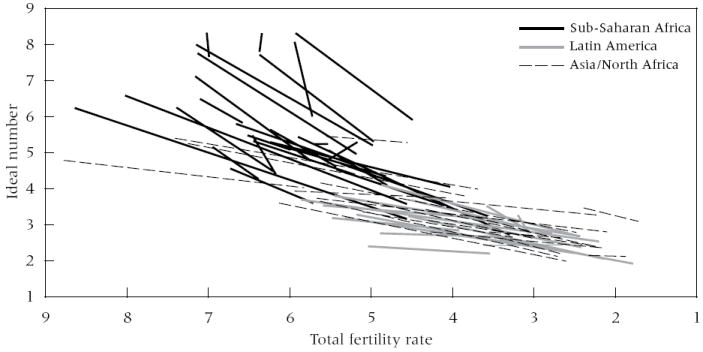
NOTE: Earliest and most recent survey in each country, n = 63 countries.
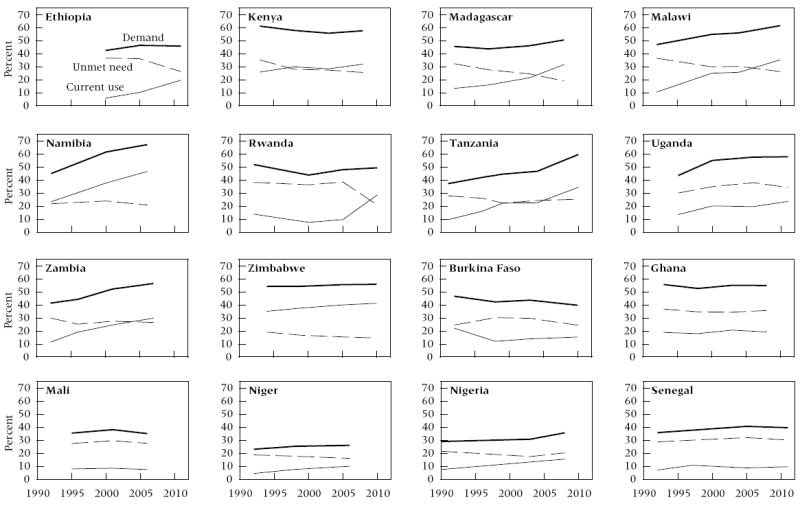
NOTE: Sample is onset of fertility decline as of earliest survey. n = 27 countries.
References
-
- Bledsoe Caroline, Banja Fatoumatta, Hill Allan G. Reproductive mishaps and Western contraception: An African challenge to fertility theory. Population and Development Review. 1998;24(1):15–57.
-
- Bongaarts John. The measurement of wanted fertility. Population and Development Review. 1990;16(3):487–506.
-
- Bongaarts John. Can family planning programs affect high desired family size in sub-Saharan Africa? International Perspectives on Sexual and Reproductive Health. 2011;37(4):209–216. - PubMed
-
- Bongaarts John, Bruce Judith. The causes of unmet need for contraception and the social content of services. Studies in Family Planning. 1995;26(2):57–75. - PubMed
-
- Bongaarts John, Watkins Susan Cotts. Social interactions and contemporary fertility transitions. Population and Development Review. 1996;22(4):639–682.
Grants and funding
LinkOut - more resources
Full Text Sources
Other Literature Sources