. 2014 Jun;124(6):2571-84.
doi: 10.1172/JCI73408. Epub 2014 May 8.

Enhanced sphingosine-1-phosphate receptor 2 expression underlies female CNS autoimmunity susceptibility

Enhanced sphingosine-1-phosphate receptor 2 expression underlies female CNS autoimmunity susceptibility

Lillian Cruz-Orengo et al. J Clin Invest. 2014 Jun.

Abstract

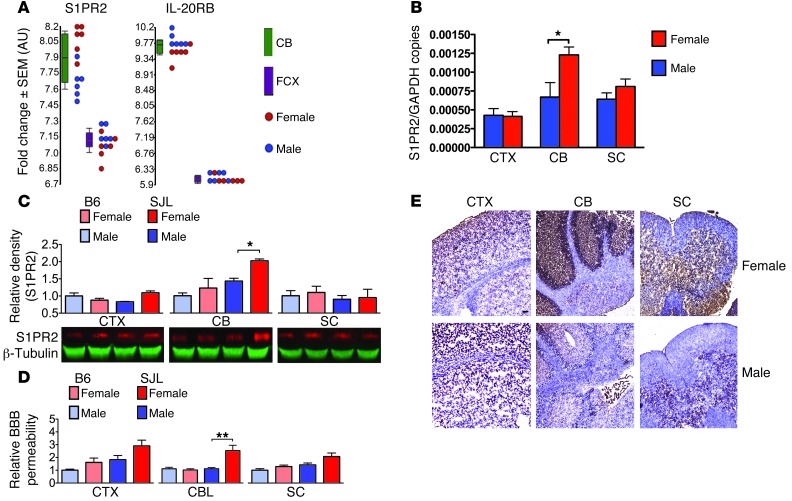
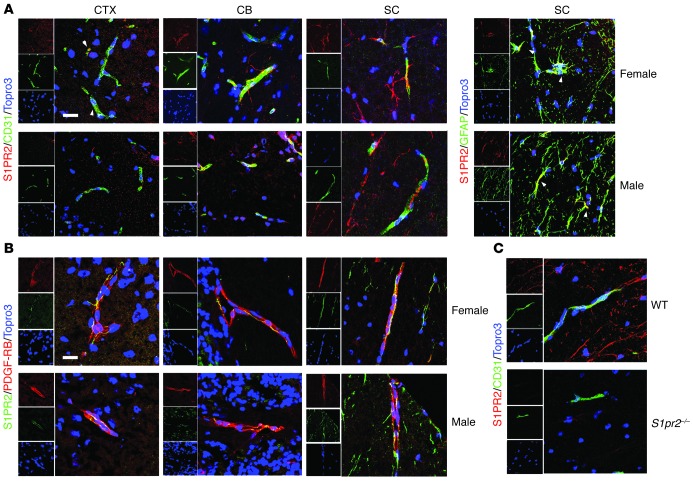
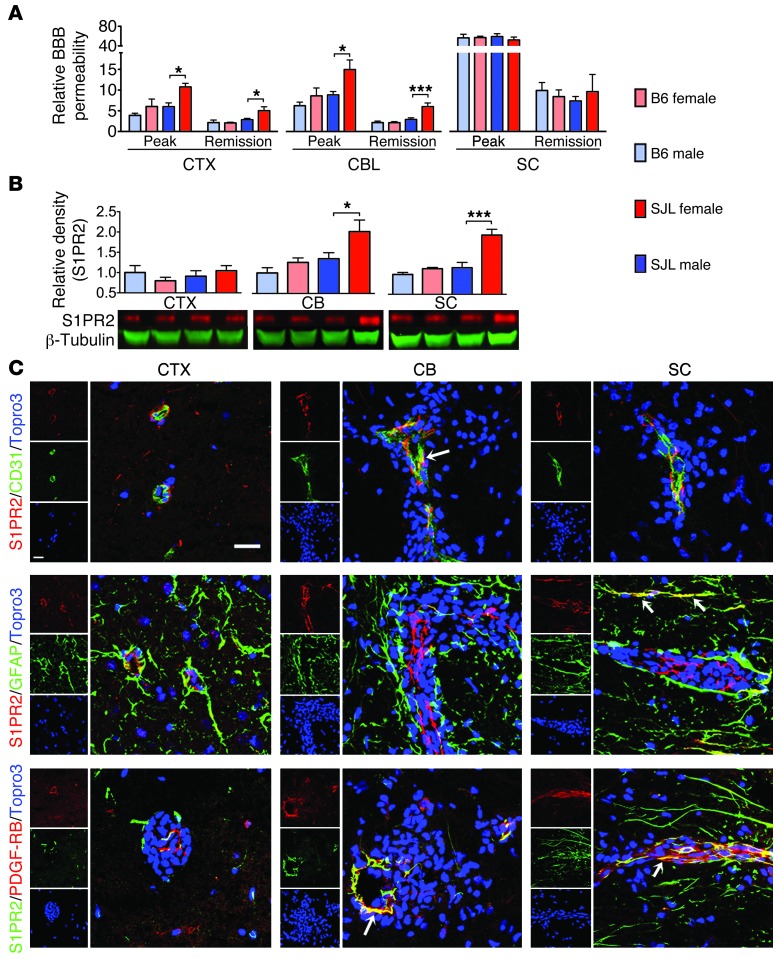
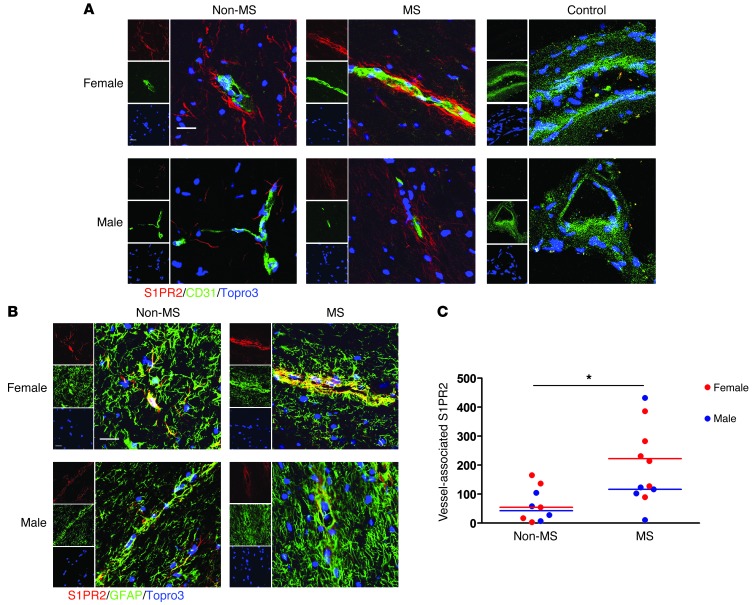
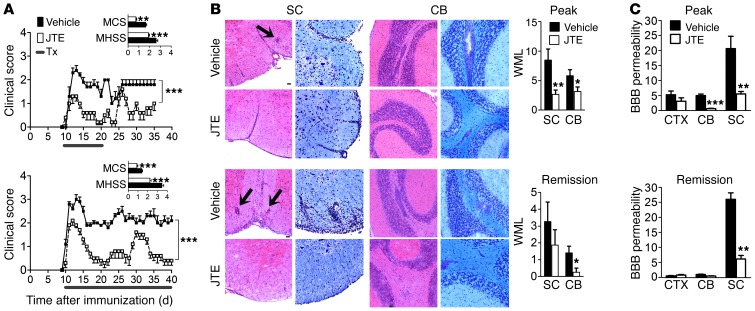
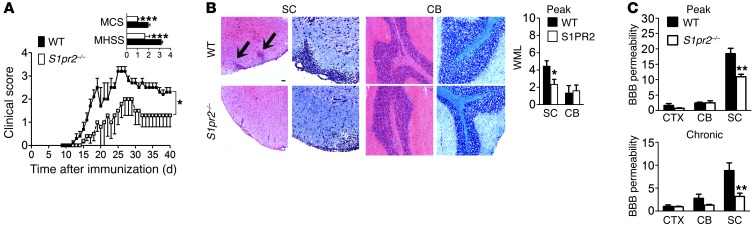
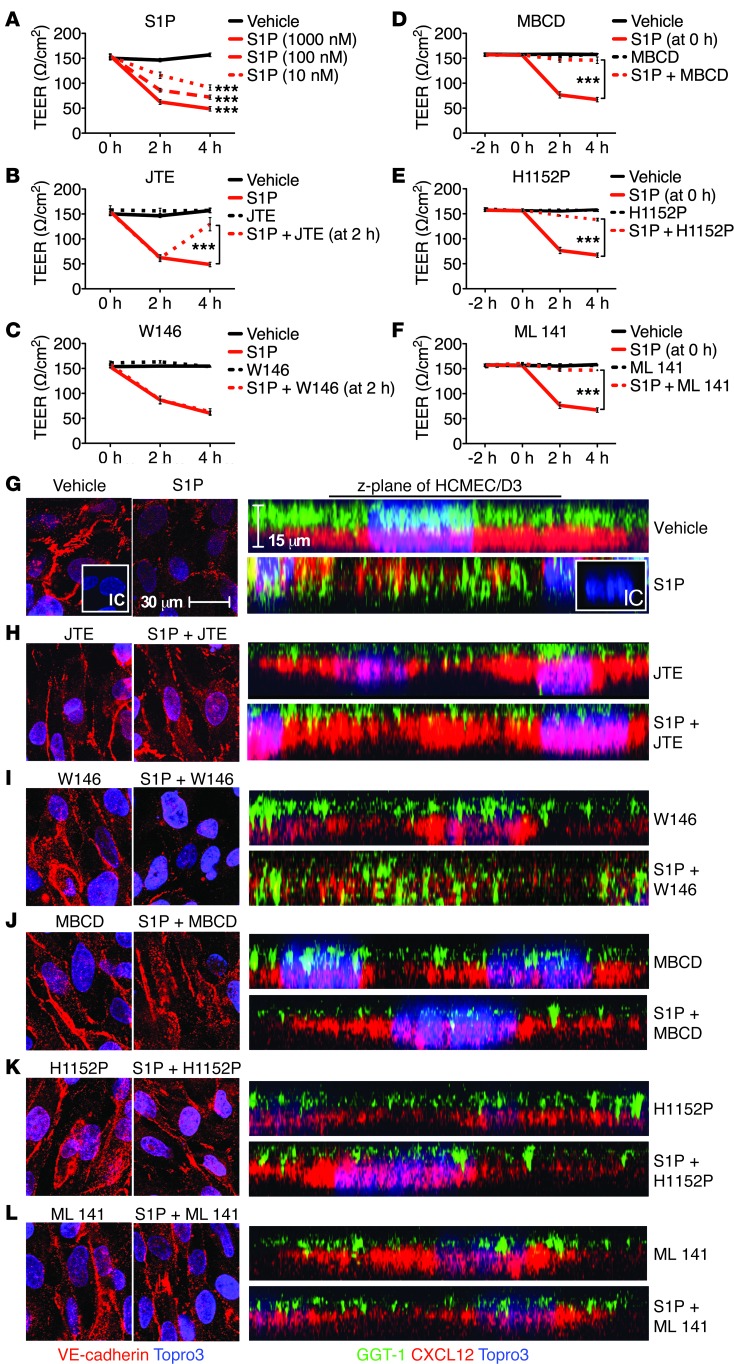
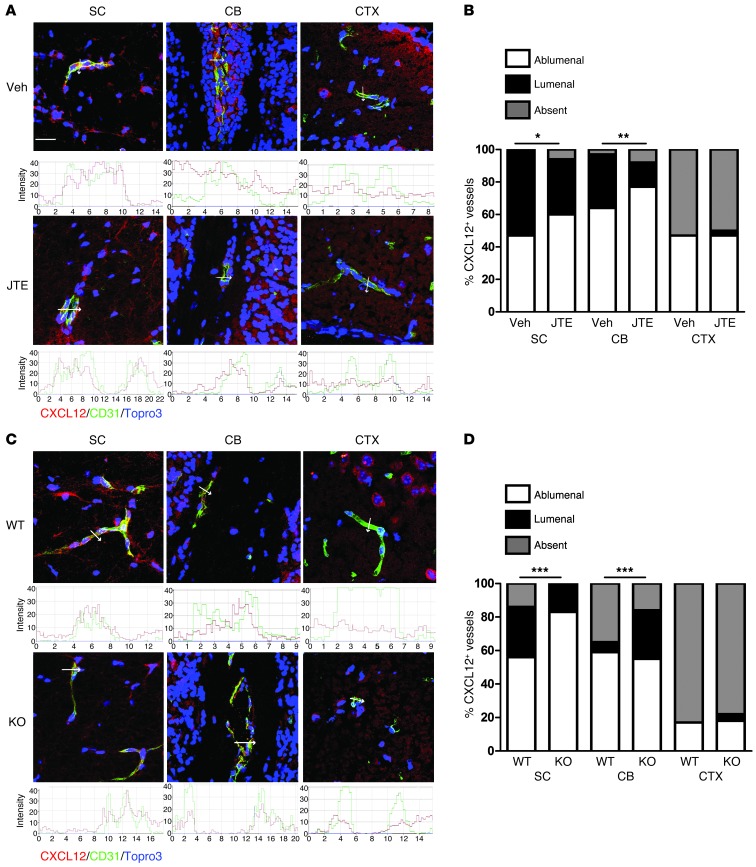
Multiple sclerosis (MS) is an inflammatory disease of the CNS that is characterized by BBB dysfunction and has a much higher incidence in females. Compared with other strains of mice, EAE in the SJL mouse strain models multiple features of MS, including an enhanced sensitivity of female mice to disease; however, the molecular mechanisms that underlie the sex- and strain-dependent differences in disease susceptibility have not been described. We identified sphingosine-1-phosphate receptor 2 (S1PR2) as a sex- and strain-specific, disease-modifying molecule that regulates BBB permeability by destabilizing adherens junctions. S1PR2 expression was increased in disease-susceptible regions of the CNS of both female SJL EAE mice and female patients with MS compared with their male counterparts. Pharmacological blockade or lack of S1PR2 signaling decreased EAE disease severity as the result of enhanced endothelial barrier function. Enhanced S1PR2 signaling in an in vitro BBB model altered adherens junction formation via activation of Rho/ROCK, CDC42, and caveolin endocytosis-dependent pathways, resulting in loss of apicobasal polarity and relocation of abluminal CXCL12 to vessel lumina. Furthermore, S1PR2-dependent BBB disruption and CXCL12 relocation were observed in vivo. These results identify a link between S1PR2 signaling and BBB polarity and implicate S1PR2 in sex-specific patterns of disease during CNS autoimmunity.


Figures

Figure 1
Figure 1. S1PR2 exhibits sexually dimorphic gene expression within the CNS of naive SJL mice.
(A) Microarray analysis of S1PR2 and IL-20RB expression within cerebella (CB) (green) of female (red circles) and male (blue circles) littermates demonstrates significant alterations compared with frontal cortices (FCX) (purple). In box-and-whisker plots, horizontal bars indicate the medians, boxes indicate 25th to 75th percentiles, and whiskers indicate 10th and 90th percentiles. Data are expressed as fold change ± SEM and as individual values of Illumina probe levels. P < 0.05, ANOVA for sex- and region-specific gene expression (cerebella only). (B) QPCR evaluation of S1PR2 expression in cortices (CTX), cerebella, and spinal cords (SC) of same cohort. Data are expressed as mean S1PR2/GAPDH copies ± SEM for female (red bars) and male (blue bars) samples (n = 5). *P < 0.05, 2-way ANOVA. (C) Western blot analysis of S1PR2 in cortices, cerebella, and spinal cords in male (B6: light blue bars; SJL: blue bars) and female (B6: pink bars; SJL: red bars) C57BL/6 and SJL mice. Data are expressed as mean ± SEM densities normalized to male B6 (n = 5). *P < 0.05, 2-way ANOVA. (D) Male (light and dark blue bars) and female (pink and red bars) naive C57BL/6 and SJL mice were examined for BBB Na-Fluorescein permeability within cortices, cerebella, and spinal cords, normalized to sera values for individual mice (5–8 mice per group). Data are reported as arbitrary fluorescence values, normalized to mean ± SEM values for naive male C57BL/6 in each CNS region. **P < 0.01. (E) Immunohistochemical detection of albumen in cortices, cerebella, and spinal cords of naive female and male SJL mice. Scale bar: 25 μm. Images are representative of 3 images each from 2 to 3 mice per sex.
Figure 2
Figure 2. S1PR2 is primarily expressed by CNS endothelial cells.
(A) Immunofluorescence detection of S1PR2 (red) in female and male SJL endothelial cells (CD31, green), located in the cortex, cerebellum, and spinal cord and in spinal cord astrocytes (GFAP, green). Arrowheads identify S1PR2+ astrocytes. (B) Immunofluorescence detection of S1PR2 (green) in female and male SJL pericytes (PDGF-Rβ, red), located in the cortex, cerebellum, and spinal cord. (C) Immunofluorescence detection of S1PR2 (red) in spinal cords of 129S/B6 wild-type and S1pr2–/– mice. All nuclei were stained with Topro3 (blue). Scale bar: 25 μm. Data are representative of 10 images each from 5 female and 5 male animals.
Figure 3
Figure 3. Female SJL mice exhibit sexually dimorphic enhancement of BBB permeability and S1PR2 expression during EAE.
(A) Male and female C57BL/6 and SJL mice at peak of EAE (clinical score of 3 to 4) or first remission (clinical score of 2) were examined for BBB permeability to Na-Fluorescein within cortices, cerebella, and spinal cords, normalized to sera values for individual mice (5–8 mice per group). Data are reported as arbitrary fluorescence values, normalized to mean values for naive male C57BL/6 in each CNS region. (B) Protein lysates from CNS regions of male and female C57BL/6 and SJL mice at peak of EAE (clinical scores of 3 to 4) were probed for S1PR2 (red), with β-tubulin (green) as a loading control. Data are reported as density values of S1PR2 normalized to density values for β-tubulin. Data are normalized to mean values for male C57BL/6 mice in each CNS region. (A and B) Bar graphs depict mean ± SEM findings for male (B6: light blue bars; SJL: blue bars) and female (B6: light red bars; SJL: red bars) for 4 mice per group. *P < 0.05; ***P < 0.001, 2-way ANOVA. (C) Immunofluorescence detection of S1PR2 (red, top and middle; green, bottom) in vessels (CD31, green), astrocytes (GFAP, green), and pericytes (PDGF-Rβ, red, bottom) in cortices, cerebella, and spinal cords of female SJL mice at peak of EAE. All nuclei were stained with Topro3 (blue). Scale bar: 25 μm. Data are representative of 10 images each from 5 male and 5 female animals. Arrows indicate areas of colocalization.
Figure 4
Figure 4. BBB expression of S1PR2 is increased in MS.
(A) Endothelial cell (CD31, green) and (B) astrocyte (GFAP, green) localization of S1PR2 (red) in female and male cerebellar tissue obtained from patients with and without MS. Nuclei are counterstained with Topro3 (blue). (A) Control stains, in which sections were first blocked with immunogen (1 mg/ml) prior to detection of CD31 (green) and S1PR2 (red), are included. Scale bar: 25 μm. (C) Quantification of amounts of vessel-associated S1PR2 fluorescence in female (red circles) and male (blue circles) samples from patients with and without MS. Levels of S1PR2 fluorescence were determined by examining S1PR2 staining in venule ROIs in 10 images per patient (4–6 patients per group), normalized by area of CD31 staining to control for size and numbers of vessels. Note that the outlier in the male MS group also had a history of occipital head trauma. *P < 0.05. Horizontal bars represent geometric means.
Figure 5
Figure 5. S1PR2 inactivation ameliorates EAE and alterations in BBB permeability.
(A and B) Female SJL mice immunized with PLP139–151 were treated with vehicle or JTE-013 (JTE; 1.5 mg/kg) when mice reached a clinical score of 2. (A) Clinical scores of mice treated for 10 (top) or 30 (bottom) consecutive days ± SEM. Insets show means of cumulative scores (MCS) and of highest severity scores (MHSS) ± SEM for 10 to 15 mice per group. (B) H&E-stained (left panels) and LFB-stained (right panels) sections from spinal cords and cerebella of vehicle- and JTE-treated mice at peak of EAE (top) or remission (bottom). Bar graphs depict mean numbers of white matter lesions (WML) within both CNS regions for either peak or remission ± SEM for 5 to 6 mice per treatment group. Arrows highlight inflammatory foci. Scale bar: 25 μm. (C) Relative BBB permeability of cortex, cerebellum, and spinal cord tissues from vehicle- and JTE-treated mice at peak of EAE or remission. Data are depicted as mean fluorescence intensity, normalized against sera values for individual mice ± SEM for 6 mice per treatment group, with means normalized against mean values for untreated, naive controls. *P < 0.05; **P < 0.01; ***P < 0.001.
Figure 6
Figure 6. S1PR2 deficiency ameliorates EAE and alterations in BBB permeability.
Wild-type and S1pr2–/– mice were immunized with MOG and followed for disease progression. (A) Clinical EAE scores ± SEM. The inset shows mean of cumulative score and highest severity score ± SEM for 10 to 15 mice per genotype. (B) H&E-stained (left panels) and LFB-stained (right panels) sections derived from spinal cords and cerebella of WT and S1pr2–/– mice at peak of EAE. Scale bar: 25 μm. Bar graphs depict mean numbers of white matter lesions within both CNS regions ± SEM for 4 to 6 mice per genotype. (C) Relative BBB permeability of cortex, cerebellum, and spinal cord tissues derived from WT and S1pr2–/– mice at peak and chronic stages of monophasic EAE. Data are depicted as mean fluorescence intensity, normalized against plasma values for individual mice ± SEM for 4 to 6 mice per genotype, with means normalized against mean values for WT naive controls. *P < 0.05; **P < 0.01; ***P < 0.001.
Figure 7
Figure 7. S1PR2 signaling dysregulates CNS endothelial barrier structure and function through Rho/ROCK, CDC42, and caveolin endocytosis-dependent pathways.
(AF) Paracellular permeability of in vitro BBB cultures was assessed by electrode recording of TEER, reported in Ω/cm2. (A) TEER after treatment of in vitro BBB cultures with 10, 100, or 1,000 nM exogenous S1P for 4 hours or (B and C) 1,000 nM S1P for 4 hours with or without (B) 1,000 nM JTE-013 at 2 hours or (C) the S1PR1-specific antagonist W146 (1,000 nM) at 2 hours. (DF) TEER after 1,000 nM S1P treatment of BBB cultures pretreated for 2 hours with (D) the caveolin endocytosis inhibitor MBCD (10 mM), (E) Rho-associated protein kinase (ROCK) inhibitor H1152P (10 nM), or (F) CDC42 inhibitor ML141 (100 nM). TEER values are mean ± SEM of 6 to 9 replicates of 2 to 3 independent experiments. ***P < 0.001, repeated-measures 2-way ANOVA. (GL) Immunocytochemical staining of AJs in HCMEC/D3 cells via labeling of VE-cadherin (red, left and middle panels; scale bar: 30 μm) and confocal z-stack reconstruction of HCMEC/D3 cells (right panels; scale bar: 15 μm), demonstrating polarized expression of canonical apical marker GGT-1 (green) and basolateral CXCL12 (red) after treatment with (G) vehicle or 1,000 nM S1P for 4 hours followed by treatment with (H) JTE, (I) W146, (J) MBCD, (K) H1152P, or (L) ML141 treatment at 2 hours. Inhibitor concentrations in HL are identical to those in BF. Immunocytochemical images are representative images of 2 to 3 independent experiments. IC, isotype controls.
Figure 8
Figure 8. In vivo S1PR2 inactivation preserves BBB polarity during EAE.
Detection of CD31 (green) and CXCL12 (red) within cortices, cerebella, and spinal cords of (A and B) female SJL mice treated with vehicle or JTE-013 (1.5 mg/kg) or (C and D) wild-type and S1pr2–/– mice, all at peak of EAE. (A and C) Nuclei have been stained with Topro3 (blue). Scale bar: 10 μm. Data are representative of approximately 30 images each from 3 to 5 mice per treatment group. Quantification of fluorescence intensity during confocal microscopy for CXCL12 (red lines) and CD31 (green lines) is shown below microphotographs. Arrows indicate location transected in line plot depictions. (B and D) Quantitative analysis of location of CXCL12 expression on CD31+ venules within CNS tissues of (B) vehicle- and JTE-013–treated and (D) wild-type and S1pr2–/– mice at peak of EAE. Data are derived from venules analyzed within 30 images per brain region for 3 to 5 mice per treatment group and are expressed as (mean ± SEM) percentages of vessels with abluminal, lumenal, or absent CXCL12 signal. *P < 0.05; **P < 0.01; ***P < 0.001 for χ2 comparisons between CXCL12 locations within each brain region.

Comment in

References

    1. Compston A, Coles A. Multiple sclerosis. Lancet. 2008;372(9648):1502–1517. doi: 10.1016/S0140-6736(08)61620-7. - DOI - PubMed
    1. Handel AE, Jarvis L, McLaughlin R, Fries A, Ebers GC, Ramagopalan SV. The epidemiology of multiple sclerosis in Scotland: inferences from hospital admissions. PLoS One. 2011;6(1):e14606. doi: 10.1371/journal.pone.0014606. - DOI - PMC - PubMed
    1. Orton SM, et al. Sex ratio of multiple sclerosis in Canada: a longitudinal study. Lancet Neurol. 2006;5(11):932–936. doi: 10.1016/S1474-4422(06)70581-6. - DOI - PubMed
    1. Smith-Bouvier DL, et al. A role for sex chromosome complement in the female bias in autoimmune disease. J Exp Med. 2008;205(5):1099–1108. doi: 10.1084/jem.20070850. - DOI - PMC - PubMed
    1. Spence RD, Voskuhl RR. Neuroprotective effects of estrogens and androgens in CNS inflammation and neurodegeneration. Front Neuroendocrinol. 2012;33(1):105–115. doi: 10.1016/j.yfrne.2011.12.001. - DOI - PMC - PubMed

Publication types

MeSH terms

Substances