. 2014 May 8;157(4):795-807.
doi: 10.1016/j.cell.2014.03.035.

A proliferative burst during preadolescence establishes the final cardiomyocyte number

Affiliations

A proliferative burst during preadolescence establishes the final cardiomyocyte number

Nawazish Naqvi et al. Cell. .

Abstract

It is widely believed that perinatal cardiomyocyte terminal differentiation blocks cytokinesis, thereby causing binucleation and limiting regenerative repair after injury. This suggests that heart growth should occur entirely by cardiomyocyte hypertrophy during preadolescence when, in mice, cardiac mass increases many-fold over a few weeks. Here, we show that a thyroid hormone surge activates the IGF-1/IGF-1-R/Akt pathway on postnatal day 15 and initiates a brief but intense proliferative burst of predominantly binuclear cardiomyocytes. This proliferation increases cardiomyocyte numbers by ~40%, causing a major disparity between heart and cardiomyocyte growth. Also, the response to cardiac injury at postnatal day 15 is intermediate between that observed at postnatal days 2 and 21, further suggesting persistence of cardiomyocyte proliferative capacity beyond the perinatal period. If replicated in humans, this may allow novel regenerative therapies for heart diseases.


Figures

Figure 1
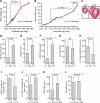
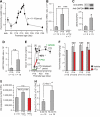
Figure 1. Rapid Body Growth Involves CM Elongation and Eccentric LV Remodeling
(A and B) Concomitant increases in body and heart weights of WT mice during the period from preadolescence (P10) to just after puberty (P35). (C) Increase in heart size from P10 to P35 is illustrated by hematoxylin and eosin stained coronal heart sections. (D to L) Hemodynamic and cardiac and CM morphological changes in WT mice from P10 to P35. LVEDD and LVED volume, left ventricular end-diastolic dimension and volume, respectively; LV FWd, LV free wall thickness in diastole. Data are shown as mean ± SEM. The number of animals,or cells, studied is shown by n. ***p< 0.001.
Figure 2
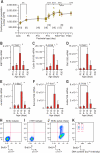
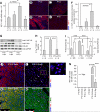
Figure 2. A Period of CM Proliferation During Preadolescent Heart Growth
(A) Total numbers of cardiomyocytes in both cardiac ventricles of mice (CM population number, CPN). The number of animals studied is shown in square brackets. (B to G) Enhanced expression of the mitosis-related genes, Ki67, Cyclin B1, polo-like kinase-1 (Plk 1), aurora A, Survivin and anillin on P15. Also note suppressed expression of all these genes in P35 hearts (P< 0.001 versus P13 values). Values were determined using RNA prepared from 5 animals at each time point. (H to J) An example of flow cytometric analysis of BrdU+/cardiac troponin T+ (cTnT+) CM-derived nuclei obtained from a mouse given a single intraperitoneal injection of BrdU on the night of P14 and then sacrificed on P18. (K) A representative example of analysis of BrdU uptake (at P14 evening) and ploidy, indicating that 96.4% of nuclei were 2n and 3.6% were 4n (on P18) in this cell preparation from a single heart. Data are shown as mean ± SEM. *p < 0.05; **p < 0.01; ***p < 0.001.
Figure 3
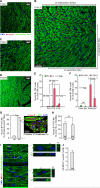
Figure 3. The Proliferative Burst is Temporally Discrete, and Involves Division of Predominantly Subendocardial CMs
(A to D) Immunohistochemical identification of mitotic CMs (red staining, aurora B+ cells) in transverse cut tissue sections showing localization in the subendocardial regions of the left ventricle (LV) of P15 mice, with few aurora B+ cells evident in the subepicardial regions of the left ventricle, in the right ventricle (RV) or in LV sections of P14 or P16 hearts.The nuclear localization of aurora B indicates that these CMs are in prophase. (E and F) Quantitation of aurora B+ cells identified (A to D), as seen in various regions of the LV and RV of P14, P15 and P16 hearts. (G) Quantitation of LV aurora B+ P15-CMs showing that ~90% are bi-nucleated. In the adjacent photomicrograph the punctate aurora B staining (red) indicates that these CMs, labeled P, are in prophase. In another CM, labeled A (anaphase), aurora B localization between nuclei pairs is consistent with its localization at centromeres between kinetochores, or at the anaphase spindle midzone (asm). Note also the loss of cross-striations and marginalization of sarcomeric structures in the CM labeled A; blue, DAPI; green, α-MHC. (H) Approximately equal percentages of P15 1N and 2N CMs are aurora B+. (I) CMs in late telophase/cytokinesis in longitudinal sections of the LV subendocardium, detected using an MKLP1 antibody. Arrowheads indicate XY and XZ reconstruction planes in the enlarged insets. (J) Frequency of MKLP-1+CM-specific events in transverse sections of the LV subendocardium. Data are shown as mean ± SEM. The number of animals studied is shown by n or by values in square brackets. **p< 0.01; ***p< 0.001; gp., group. See also FiguresS2, S3, and S4.
Figure 4
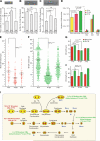
Figure 4. Increase in CM Population Number (CPN) involves Division of Mono- and Binuclear CMs
(A to C) Percentage of mononuclear (mono-CM), binuclear (bi-CM) and multinuclear (multi-CM) CMs in the hearts of P14, the afternoon of P15 (P15A) and P18 mice. (D) Number of CMs in cardiac ventricles of P14, P15A and P18 mice. Total numbers are shown in the left panel and the numbers of mono-, bi-, and multinuclear CMs in these hearts is shown in the right panel (these data are from Figure 2A). We calculated the number of mono-, bi-, and multinuclear CMs that are added to the cardiac ventricles by multiplying the average CPN (Figure 2A) with the percentage of CMs that were mono-, bi- or multinuclear at these developmental ages (shown in Figures 4A–4C). In A–D the number of animals studied is shown by the value in square brackets. (E to H) Volume (E and F), width (G) and length (H) of mono- and binuclear CMs in P14, P15A and P18 mouse hearts. The volume of individual CMs is represented by a red (mono-CM) or green dot (bi-CM), and was from the hearts of 5 mice at each time indicated (E and F). In G and H, histograms represent average widths or length of CMs (n = 69–107 mono-CMs/group and n = 391–512 bi-CMs/group) from 5 mice at each time indicated. (I) Scheme illustrating potential modes of cell cycling during maturational heart growth.Mononuclear CMs undergo a conventional cell cycle to replicate.Binuclear CMs remain static or undergo cell division. This involves each of the two nuclei undergoing karyokinesis,with cytokinesis taking place between nuclei pairs. This generates two mononuclear CMs at the two poles and a smaller binuclear CM remains at the center. Overall, these processes increasethe number of mononuclear CMs, without greatly changing the number of binuclear CMs. However, between P14 and the afternoon of P15 (P15A), mono- and binuclear CM volume decreases because smaller daughter cells are generated from larger preexisting CMs. Data are shown as mean ± SEM. **p< 0.01; ***p< 0.001. See Figure S1 and Table S1.
Figure 5
Figure 5. Disparity in the Relationship between Heart and Body Growth, withCM proliferation requires a T3 Surge
(A) Temporal change in heart-to-body weight ratios of WT mice showing that heart growth exceeds body growth between P10 and P18. (B and C) Increase in LV α/β-MHC mRNA ratio (B) and in α-MHC expression (Western blot above; quantitation below) (C) from P10 and P14, and blockade of the increase in mRNA ratio by PTU (B). (D) Expression of ANP mRNA is not significantly changed between P10 and P14. (E) 3,3’,5-triiodo-L-Thyronine (T3) levels increase markedly between P10 and P12 and remain stable thereafter. The increase in T3 is abrogated by PTU (red dot and green bar). (F and G) Increase in heart-to-body weight ratio from P10 to P14, P15, and P18, and inhibition of these increases by PTU (F). PTU also prevents the increase in CPN between P10 and P18 (G). (H) Treatment of cultured cardiomyocytes isolated from P14 mice with T3 for 7 days increased the percentage of BrdU+ CMs (cTnT+). Data shown are the means ± SEM.The number of individual animals studied is shown by n. *p < 0.05; **p < 0.01; ***p < 0.001. See Figures S5 and S6and Table S2.
Figure 6
Figure 6. Increased Expression of IGF-1 mRNA and IGF-1 in P15 Ventricles Causes IGF1-R and Akt Phosphorylation that is inhibited by PTU
(A–F) Ventricular IGF-1 mRNA levels and IGF-1 immunostaining (IGF-1, red and DAPI, blue staining, B–E; quantitation, F) at P10, P14, P15 and P16, showing significant increases from P10 to a peak at P15. (G–I) Immunoblotting (G) of ventricular myocardium obtained from P10 and P15 mice, and quantitation showing significant increases in the P-IGF1-R- (H), and P-Akt-to-total Akt ratios (I)between P10 and P15 and suppression of these increases at P15 by PTU treatment. Total Akt/GAPDH levels did not significantly change between P10 and P15 (I). (J–K) Cytosolic Akt localization in P10 LV sections (red) (J). In the presence of αMHC staining (green) the cytoplasm appears yellow due to co-localization of Akt with αMHC (K). (L–M) Nuclear Akt localization in P15 LV sections is evident from the purple staining (white arrows), which results from the co-localization of Akt (red) with DAPI (blue), and isalso shown in the adjacent magnified panel (L);nuclear localization of Akt (purple; white arrowsremains unchanged with staining of cytoplasmically-localized αMHC (green) (M). (N) Quantitation of Akt+ CM nuclei shows few if any cells in P10 right ventricle (RV), in the endocardium (Endo) and epicardium (Epi) of P10 LV, and in P15 RV. In P15 LV, Akt+ CM nuclei are readily identified but are 51-fold more abundant in endo- versus epicardium.n = 3–7 animals for each individual evaluation Data shown are the means ± SEM. In all studies. *p<0.05; ***p<0.001.
Figure 7
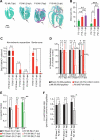
Figure 7. Reparative Response of P2, P15 and P21 Hearts to Myocardial Infarction
(A) Representative coronal sections of hearts from P2 and P15 mice at 7- and 21-days post myocardial infarction (MI; dpi) induced by left anterior descending coronary artery ligation. Sections are stained with picrosirius red to delineate scar tissue (arrows), and fast greento delineate viable myocardium.Note the virtual absence of scar tissue in P2-MI mice at 7 and 21dpi, compared to mice whose MI occurred at P15. (B) Percent infarct size relative to the LVof P2, P15 and P21 mice 1- and 7-dpi determined from 2,3,5-triphenyltetrazolium chloride and picrosirius red with fast greenstained sections, respectively. Note the differences in infarct sizes at 7-dpi despite similar infarct sizes at 1-dpi. (C) BrdU+/α-MHC+CMs in the remote (non-ischemic) and border zones of P2, P15 and P21 hearts at 7dpi, showing fewer cells with evidence of DNA synthesis (BrdU incorporation) in P15 hearts compared to P2 hearts, and the absence of such cells in P21 hearts. (D) LV fractional shortening (FS) of P2, P15 and P21 hearts at 7-dpi or sham-operation, determined from B-mode echocardiographic views at the mid-papillary or apical (peri-infarct) levels. Note, the reduction in FS in P15 hearts and the more marked reduction in FS in P21 hearts. (E) Echocardiographically-determined LV ejection fraction (EF) of P2, P15 and P21 hearts at 7dpi or shamoperation. Consistent with the changes in FS, note the significant reduction in EF in the P21 hearts. (F) Echocardiographically-determined LV wall thickness of P2, P15 and P21 hearts at 7dpi, expressed as a ratio of wall thickness in the peri-infarct or control regions to that at the midpapillary level. Consistent with the reductions in FS and EF, note the significant reduction in LV wall thickness in the P21 hearts. Data shown are the means ± SEM. In all studies, n = 3–7 animals for each individual evaluation. *p<0.05; **p<0.01; ***p<0.001.

Comment in

References

    1. Bizzozero G. Growth and regeneration of the organism. Br. Med. J. 1894;1:728–732.
    1. Chaudhry HW, Dashoush NH, Tang H, Zhang L, Wang X, Wu EX, Wolgemuth DJ. Cyclin A2 mediates cardiomyocyte mitosis in the postmitotic myocardium. J. Biol. Chem. 2004;279:35858–35866. - PubMed
    1. Chowdhury D, Ojamaa K, Parnell VA, McMahon C, Sison CP, Klein I. A prospective randomized clinical study of thyroid hormone treatment after operations for complex congenital heart disease. J. Thorac. Cardiovasc. Surg. 2001;122:1023–1025. - PubMed
    1. Condorelli G, Drusco A, Stassi G, Bellacosa A, Roncarati R, Iaccarino G, Russo MA, Gu Y, Dalton N, Chun,g C, et al. Akt induces enhanced myocardial contractility and cell size in vivo in transgenic mice. Proc Natl Acad Sci USA. 2002;99:12333–12338. - PMC - PubMed
    1. Dai W, Kloner RA. Cardioprotection of insulin-like growth factor-1 during reperfusion therapy: what is the underlying mechanism or mechanisms? Circ Cardiovasc Interv. 2011;4:311–313. - PubMed

Publication types

Substances