. 2014 May 8;157(4):882-896.
doi: 10.1016/j.cell.2014.03.026.

Defective mitophagy in XPA via PARP-1 hyperactivation and NAD(+)/SIRT1 reduction

Affiliations

Defective mitophagy in XPA via PARP-1 hyperactivation and NAD(+)/SIRT1 reduction

Evandro Fei Fang et al. Cell. .

Abstract

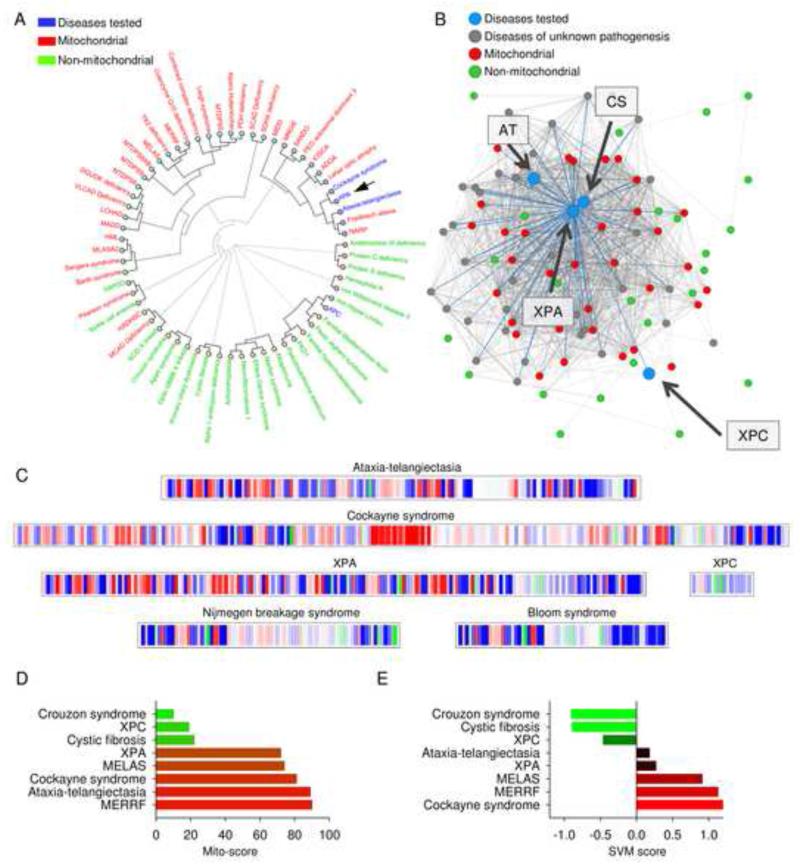
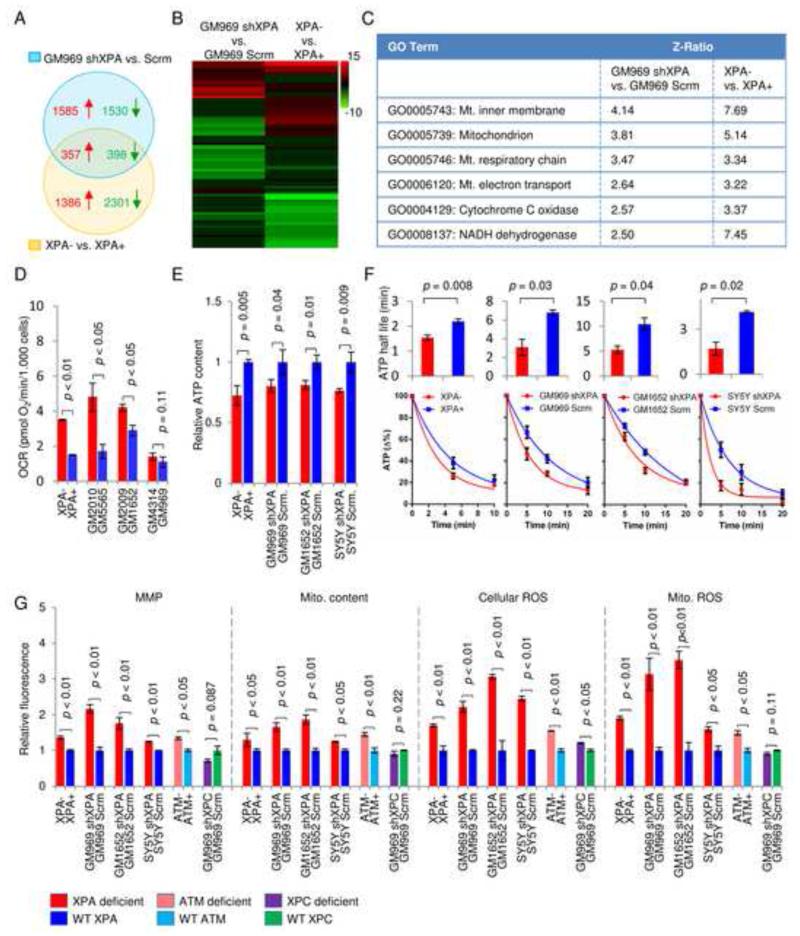
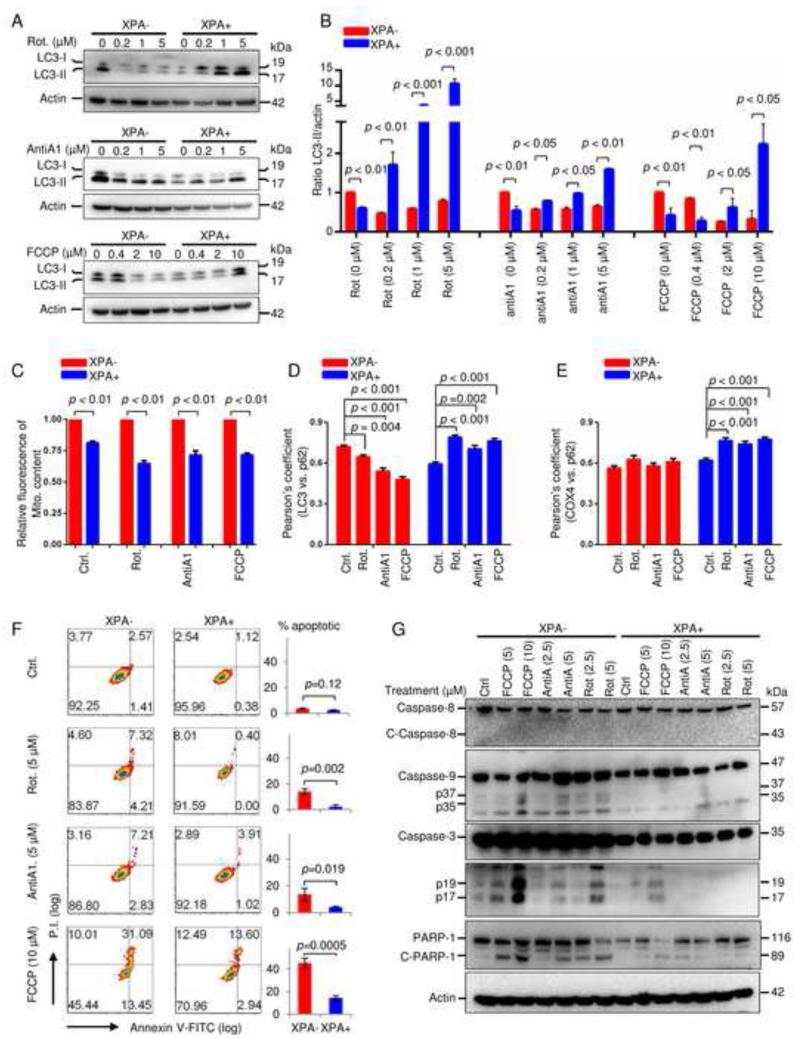
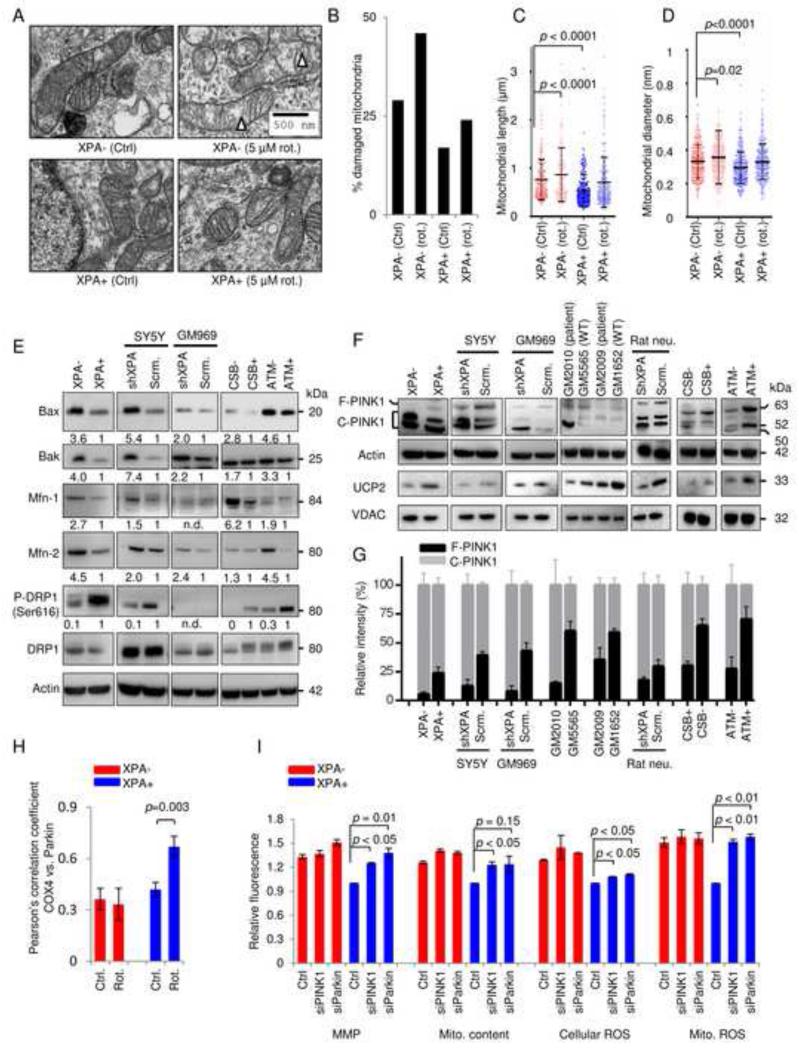
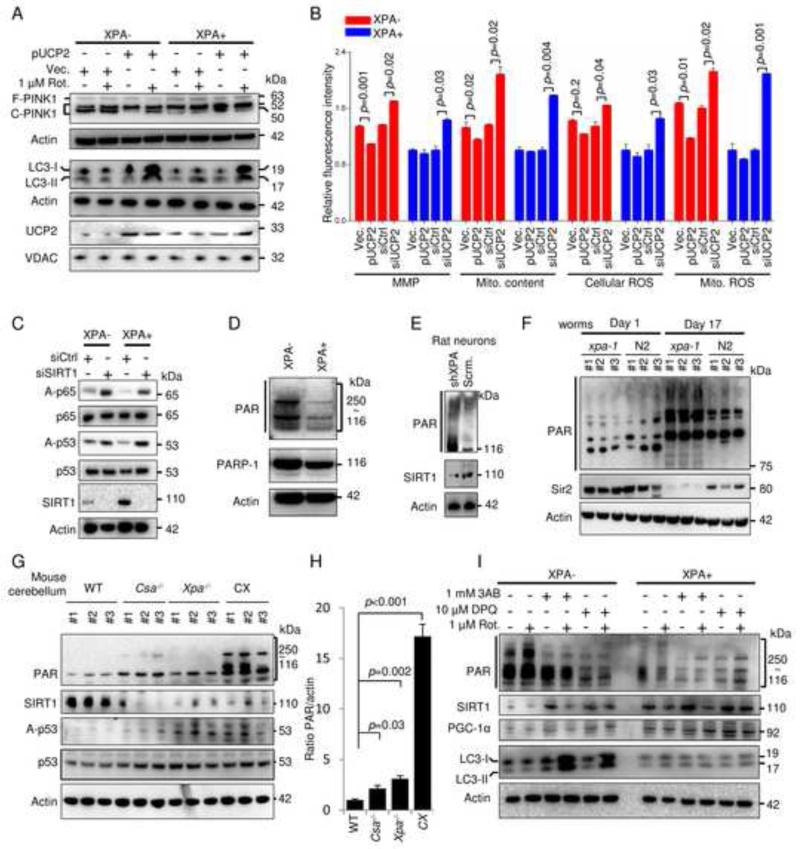
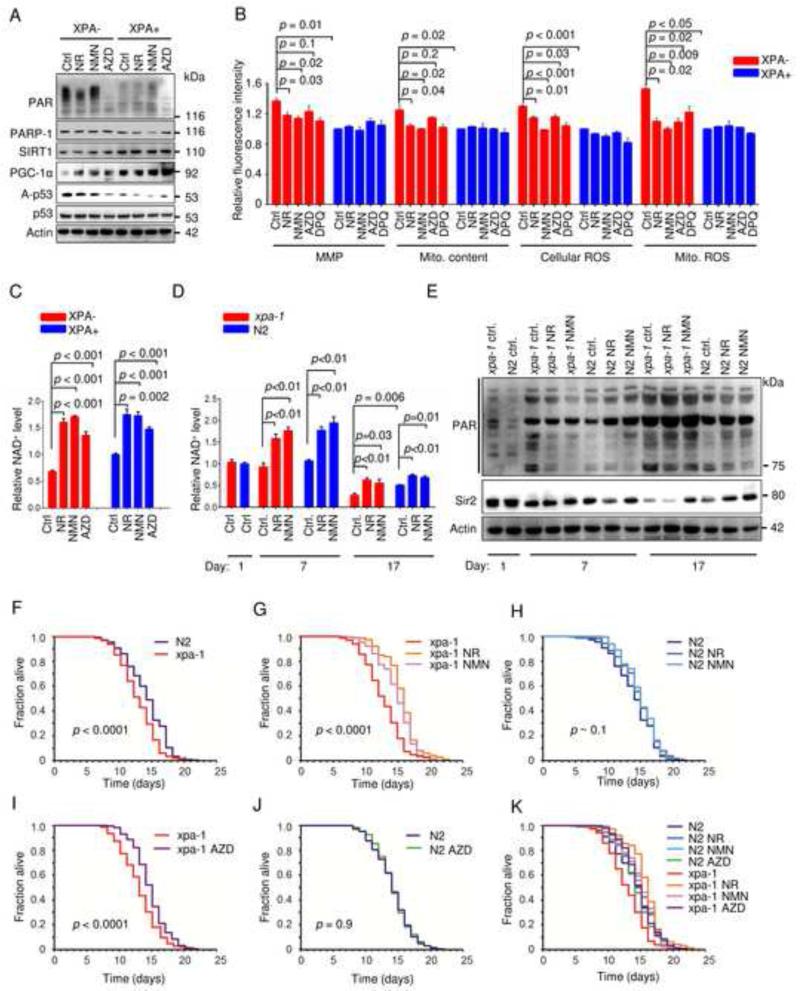
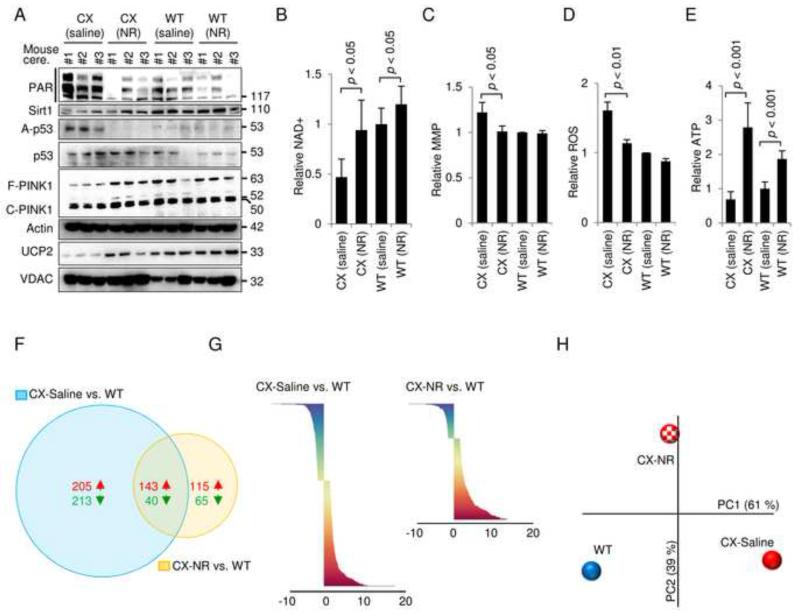
Mitochondrial dysfunction is a common feature in neurodegeneration and aging. We identify mitochondrial dysfunction in xeroderma pigmentosum group A (XPA), a nucleotide excision DNA repair disorder with severe neurodegeneration, in silico and in vivo. XPA-deficient cells show defective mitophagy with excessive cleavage of PINK1 and increased mitochondrial membrane potential. The mitochondrial abnormalities appear to be caused by decreased activation of the NAD(+)-SIRT1-PGC-1α axis triggered by hyperactivation of the DNA damage sensor PARP-1. This phenotype is rescued by PARP-1 inhibition or by supplementation with NAD(+) precursors that also rescue the lifespan defect in xpa-1 nematodes. Importantly, this pathogenesis appears common to ataxia-telangiectasia and Cockayne syndrome, two other DNA repair disorders with neurodegeneration, but absent in XPC, a DNA repair disorder without neurodegeneration. Our findings reveal a nuclear-mitochondrial crosstalk that is critical for the maintenance of mitochondrial health.


Figures

Figure 1
Figure 1. Patients suffering from XPA are phenotypically similar to patients suffering from mitochondrial diseases
(A) Hierarchical clustering of diseases based on the prevalence of clinical parameters using mitodb.com. (B) A representation of how XPA, XPC, CS and AT associate within the disease network. Each dot represents a disease and the connecting lines represent one or more shared sign and/or symptom. The shorter and thicker the line the greater the prevalence of the shared symptoms. (C) The mitochondrial barcode of XPA, XPC, CS, AT, Nijmegen breakage syndrome and Bloom syndrome. Each vertical bare represent a sign or symptom that is shared with another disease in the database. Mitochondrial (red), non-mitochondrial (green) and diseases of unknown pathogenesis (blue). A predominantly red barcode will indicate similarities with mitochondrial diseases while green will indicate non-mitochondrial involvement. (D) and (E) The mito-score (D) and the support vector machine (SVM) score (E) of XPA, XPC, CS and AT as well as two non-mitochondrial diseases Crouzon syndrome and cystic fibrosis and two bona fide mitochondrial disorders mitochondrial myopathy, encephalopathy, lactic acidosis, and stroke-like episodes (MELAS) and myoclonic epilepsy associated with ragged-red fibers (MERRF). See also Table S1.
Figure 2
Figure 2. XPA deficiency increases mitochondrial metabolism, membrane potential and ROS formation
(A) Venn diagrams illustrating the overlap of induced (red, z-score > 1.5) and repressed (green, z-score < −1.5) genes between two groups of XPA deficient cells by microarray (n=3). (B) Heat map of microarray data showing significantly changed GO-pathways. (C) Common statistically significantly upregulated mitochondrial pathways in XPA deficient cells compared with controls. Also see Figure S1A. (D) Oxygen consumption rates in primary fibroblasts from XPA patients and their age and sex matched controls (means ± SD, n=3). (E) and (F) ATP levels and ATP consumption in XPA deficient and control cells were detected using a luciferase based assay after inhibition of ATP production with oligomycin and 2-deoxyglucose at time=0 (means ± SD, n=3). Data in (F) was fitted to an exponential decay curve and half-lives were calculated (means ± SD, n=3). (G) Flow cytometry was used to measure mitochondrial membrane potential (MMP) using TMRM staining, mitochondrial content using MitoTracker Green, cellular reactive oxygen species (ROS) using dihydroethidium and mitochondrial ROS using Mitosox (means ± S.D., n=3). See also Figure S1 and Figure S2.
Figure 3
Figure 3. XPA deficiency impairs cellular mitophagy and sensitizes cells to caspase-9 regulated apoptosis under multiple mitochondrial stresses
(A) Cells were treated with mitochondrial toxins for 24 h, and LC3 was detected by immunoblot in total cell lysates. Rotenone: a mitochondrial complex I inhibitor, antimycin A: a mitochondrial complex III inhibitor, FCCP: a mitochondrial uncoupler. (B) Quantitative values of relative LC3-II levels normalized to Actin (means ± S.D., n=3). (C) Relative values of mitochondrial content in XPA− and XPA+ cells after different treatments using flow cytometry (means ± S.D., n=3). (D, E) Quantification of colocalization of LC3 and p62 (D) or COX4 and p62 (E) after treatment with mitochondrial toxins as determined by Pearson’s correlation coefficient using confocal microscopy (means ± S.E.M., n>50). See also Figure S4A and S4B. (F) Detection of apoptosis using flow cytometry in XPA− and XPA+ cells with Annexin-V/PI staining after mitochondrial stressors. Quantification is shown on the right (means ± S.D., n=3). (G) Immunoblot of the expression of proteins involved in caspase-8 regulated and caspase-9 regulated apoptotic pathways in XPA− and XPA+ cells exposed to different mitochondrial toxins. See also Figure S4.
Figure 4
Figure 4. XPA deficiency suppresses mitophagy by up-regulation of mitochondrial fusion and cleavage of PINK1
(A-D) XPA− and XPA+ cells were treated with 5 μM rotenone or vehicle for 24 h, and electron microscopy was performed (A). Triangles indicate damaged mitochondria. Quantification of damaged mitochondria (B), mitochondrial length (C) and mitochondrial diameter (D), (means ± S.D., n=14, with >150 mitochondria counted per group). (E) Immunoblot of proteins involved in mitochondrial size regulation. Bax, Bak, mitofusin-1 (Mfn-1), and Mfn-2 participate in mitochondrial fusion whereas phosphorylation of DRP1 at Ser616 is involved in mitochondrial fission. (F) Protein expression of PINK1 and UCP2 levels in XPA deficient cells and tissues. (G) Quantification of (F) showing full length and cleaved PINK1 normalized to total PINK1 (means ± S.D., n=3). (H) The colocalization between COX-4 and Parkin in XPA− and XPA+ cells treated with 5 μM rotenone for 24 h and quantified using the Pearson’s correlation coefficient (means ± S.D., n=3 and Figure S4D). (I) Various mitochondrial parameters in XPA+ and XPA− cells after siRNA knockdown of PINK1 and Parkin (means ± S.D., n=3 and Figure S4F-G for knockdown efficiency).
Figure 5
Figure 5. The NAD+-SIRT1-PGC1-α axis regulates the expression of UCP2 which can rescue the mitophagy defect in XPA-cells
(A) XPA− and XPA+ cells were transfected with pUCP2 or an empty vector for two days, and then treated with 1 μM rotenone or vehicle for 24 h, followed by immunoblot for proteins as indicated. (B) XPA− and XPA+ cells were transfected with pUCP2, vector, control siRNA or siRNA targeting UCP2 for two days, subsequently indicated parameters were analysed by flow cytometry (means ± S.E.M., n=3). (C) Immunoblot of XPA− and XPA+ cells after transfection with control siRNA or siRNA targeting SIRT1 (siSIRT1). (D) Representative immunoblot of PAR and PARP-1 in XPA− and XPA+ cells. (E) Immunoblot showing expression of PAR and SIRT1 in primary rat neurons with shRNA XPA knockdown or control shRNA. (F) Immunoblot of whole cell extracts from young (day 1) and old (day 17) xpa-1 mutant and WT (N2) nematodes. (G) Immunoblot of cerebellar protein levels in 2-week old WT, Csa−/−, Xpa−/− or Csa−/−/Xpa−/− (CX) mice and quantification in (H) (means ± S.D., n=3). (I) Immunoblot of XPA− and XPA+ cells treated with two PARP inhibitors, 3AB (1 mM) and DPQ (10 μM), for 12 h, followed an additional 24 h treatment in the presence of 1 μM rotenone or vehicle. See also Figure S5.
Figure 6
Figure 6. NAD+ augmentation rescues the mitochondrial and aging phenotype in XPA− cells and xpa-1 worms
(A) Immunoblot of XPA− and XPA+ cells treated for 24 h with the NAD+ precursors nicotinamide riboside (NR), nicotinamide mononucleotide (NMN) or the PARP inhibitor AZD2281. (B) Mitochondrial parameters of XPA− and XPA+ cells treated for 24 hours with NR, NMN, AZD2281 or DPQ (means ± S.E.M., n=3). (C) NAD+ levels of XPA− and XPA+ cells treated for 24 hours with NR, NMN or AZD2281 (means ± S.E.M., n=3). (D) NAD+ levels of WT (N2) or xpa-1 mutant worms treated with NR or NMN throughout their lifespan (means ± S.E.M., n=3). (E) Immunoblot of WT (N2) or xpa-1 mutants treated with NR or NMN throughout their lifespan. (F-K) Lifespan curves of WT (N2) or xpa-1 mutants treated with NR, NMN or AZD2281 throughout their lifespan (Kaplan Meyer survival curves were calculated from populations of 199 to 491 animals in each group, significance was calculated by the log-rank test).
Figure 7
Figure 7. The NAD+ precursor nicotinamide riboside can rescue the mitochondrial phenotype of CX mice in vivo
(A) Immunoblot of cerebellar proteins in 3-month old WT and CX mice treated with saline or nicotinamide riboside (NR) subcutaneous injections for 2 weeks (500 mg NR/kg body weight). Each lane is a separate mouse. (B) NAD+ levels in the cerebellum of the mice described in (A) (means ± S.D., n=4). (C) The mitochondrial membrane potential of isolated cerebellar mitochondria from mice described in (A) (means ± S.D., n=4). (D) ROS production in isolated cerebellar mitochondria from mice described in (A) (means ± S.D., n=4). (E) ATP levels in the cerebellum of mice as described in (A) (means ± S.D., n=4). (F) Venn diagram of significantly changed gene in the cerebellum when comparing CX-saline with WT-saline and CX-NR treated with WT-saline treated (n=3). (G) An overview of the significantly changed genes when comparing CX-saline vs WT-saline and CX-NR vs WT-saline (n=3). (H) Principal component analysis of the average Z-scores of all the genes in each group (n=3).

Similar articles

Cited by

References

    1. Aamann MD, Sorensen MM, Hvitby C, Berquist BR, Muftuoglu M, Tian J, de Souza-Pinto NC, Scheibye-Knudsen M, Wilson DM, 3rd, Stevnsner T, et al. Cockayne syndrome group B protein promotes mitochondrial DNA stability by supporting the DNA repair association with the mitochondrial membrane. FASEB journal: official publication of the Federation of American Societies for Experimental Biology. 2010;24:2334–2346. - PMC - PubMed
    1. Andrews ZB, Horvath B, Barnstable CJ, Elsworth J, Yang L, Beal MF, Roth RH, Matthews RT, Horvath TL. Uncoupling protein-2 is critical for nigral dopamine cell survival in a mouse model of Parkinson’s disease. The Journal of neuroscience: the official journal of the Society for Neuroscience. 2005;25:184–191. - PMC - PubMed
    1. Arczewska KD, Tomazella GG, Lindvall JM, Kassahun H, Maglioni S, Torgovnick A, Henriksson J, Matilainen O, Marquis BJ, Nelson BC, et al. Active transcriptomic and proteomic reprogramming in the C. elegans nucleotide excision repair mutant xpa-1. Nucleic acids research. 2013;41:5368–5381. - PMC - PubMed
    1. Bai P, Canto C, Oudart H, Brunyanszki A, Cen Y, Thomas C, Yamamoto H, Huber A, Kiss B, Houtkooper RH, et al. PARP-1 inhibition increases mitochondrial metabolism through SIRT1 activation. Cell metabolism. 2011;13:461–468. - PMC - PubMed
    1. Brace LE, Vose SC, Vargas DF, Zhao S, Wang XP, Mitchell JR. Lifespan extension by dietary intervention in a mouse model of Cockayne Syndrome uncouples early postnatal development from segmental progeria. Aging cell. 2013;12:1144–1147. - PMC - PubMed

Publication types

Associated data