. 2014 May 8;157(4):950-63.
doi: 10.1016/j.cell.2014.03.025.

Predictive polymer modeling reveals coupled fluctuations in chromosome conformation and transcription

Affiliations

Predictive polymer modeling reveals coupled fluctuations in chromosome conformation and transcription

Luca Giorgetti et al. Cell. .

Abstract

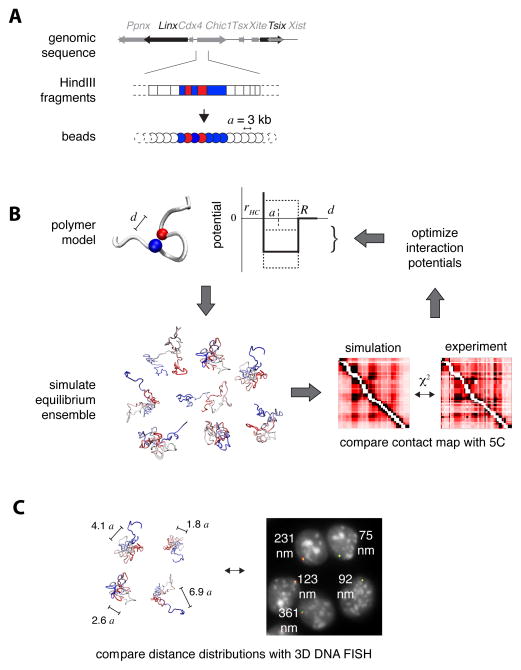
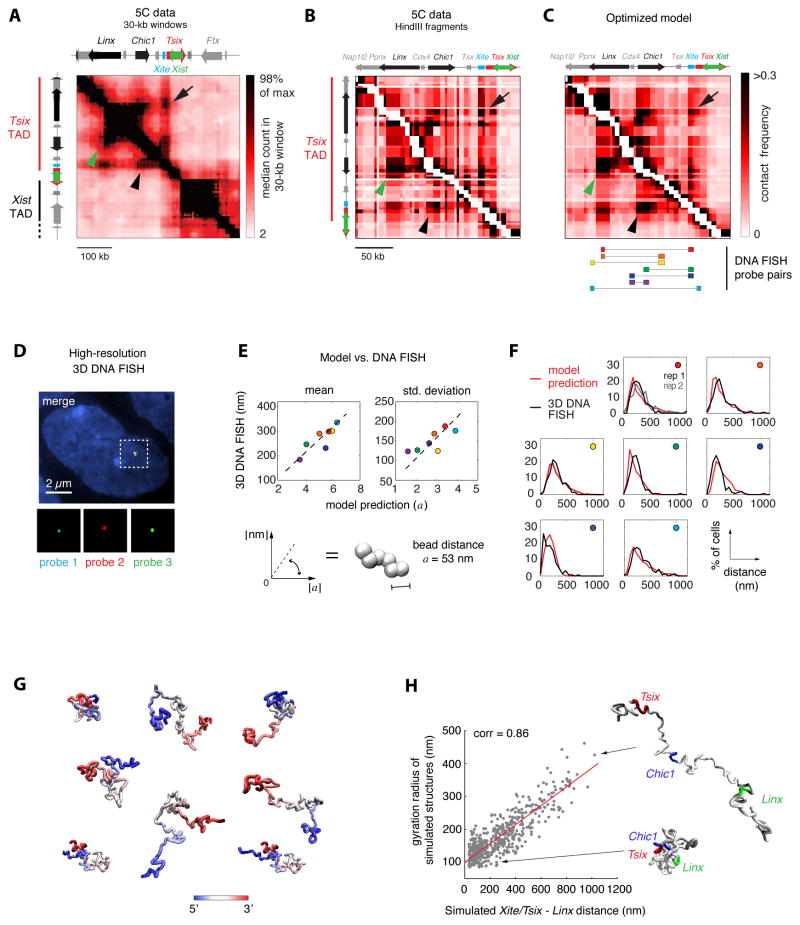
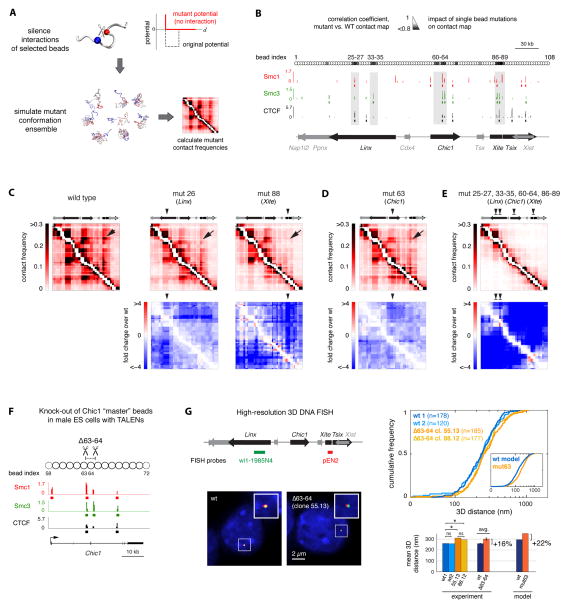
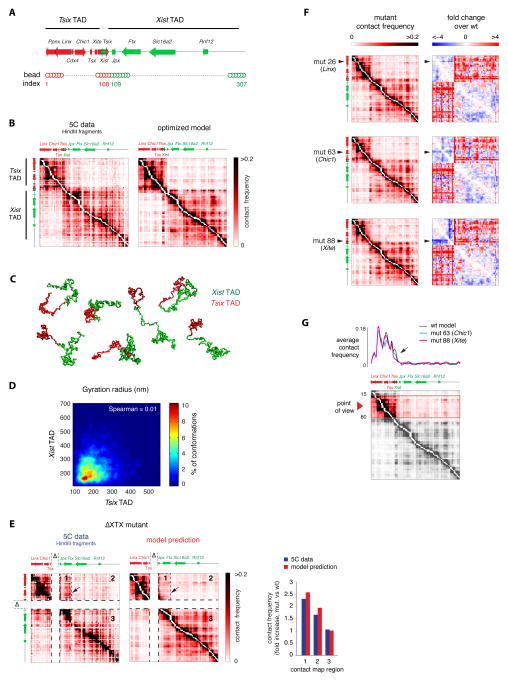
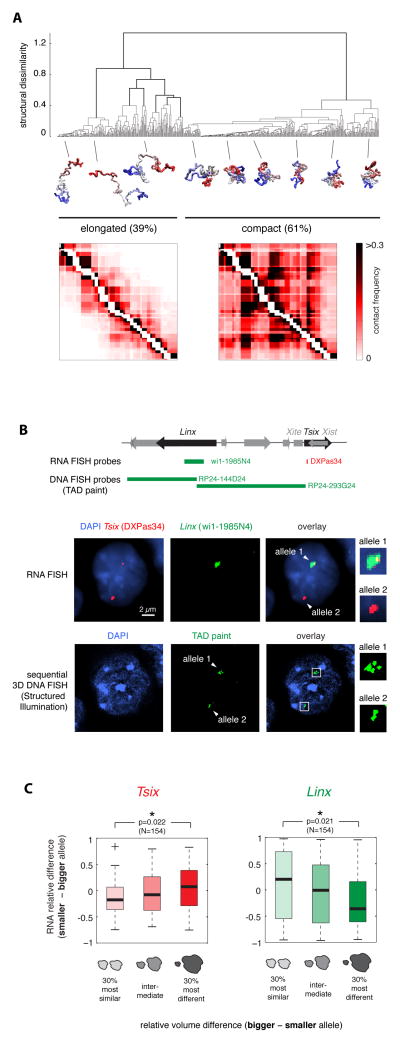
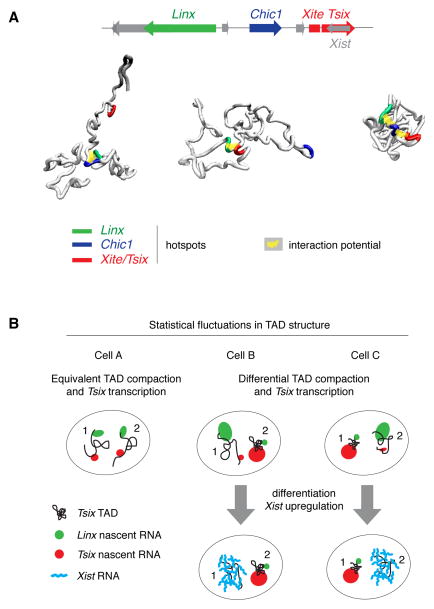
A new level of chromosome organization, topologically associating domains (TADs), was recently uncovered by chromosome conformation capture (3C) techniques. To explore TAD structure and function, we developed a polymer model that can extract the full repertoire of chromatin conformations within TADs from population-based 3C data. This model predicts actual physical distances and to what extent chromosomal contacts vary between cells. It also identifies interactions within single TADs that stabilize boundaries between TADs and allows us to identify and genetically validate key structural elements within TADs. Combining the model's predictions with high-resolution DNA FISH and quantitative RNA FISH for TADs within the X-inactivation center (Xic), we dissect the relationship between transcription and spatial proximity to cis-regulatory elements. We demonstrate that contacts between potential regulatory elements occur in the context of fluctuating structures rather than stable loops and propose that such fluctuations may contribute to asymmetric expression in the Xic during X inactivation.


Figures

Figure 1
Figure 1. Physical modeling of the chromatin fiber
A. Beads-on-a-string representation of the chromatin fiber. HindIII restriction fragments within the genomic region of interest are mapped onto sequences of adjacent beads in the model. The distance a between adjacent beads represents 3 kb. B. Structural deconvolution of 5C contact frequencies. Each bead in the model interacts with other beads through a short-range interaction potential (thick line in the scheme), which acts when the three-dimensional distance d between the two beads is smaller than the interaction radius R, and repulses them if their distance is smaller than the hardcore radius rHC. Given an initial set of interaction potentials, Monte Carlo sampling is performed to simulate the equilibrium ensemble of configurations of the fiber. Contact probabilities of this ensemble are then compared to experimental 5C contact frequencies by measuring their χ2 distance, and interaction potentials are optimized (dashed lines in the scheme) to produce a new ensemble with better agreement with 5C. This procedure is iterated until the simulated contacts converge to the experimental 5C map. C. The optimized ensemble of fiber configurations can be used to predict the physical distances between genomic loci and their distribution in the population of cells. This allows testing the model against single-cell based assays such as 3D DNA FISH.
Figure 2
Figure 2. Physical modeling reveals extensive structural variation at the Tsix TAD
A. Experimental 5C contact frequencies in the Tsix/Xist region showing the Tsix TAD and part of the Xist TADs. 5C data from (Nora et al., 2012) were smoothed with a 30-kb sliding window filter with 6 kb steps. Long-range interactions between Tsix/Xite and Linx (arrow), Tsix/Xite and Chic1 (arrowhead) and Chic1 and Linx (green arrowhead) are highlighted. B. 5C data in the Tsix TAD at single HindIII restriction-fragment scale. White pixels along the diagonal indicate adjacent restriction fragments that were not used to constrain the computational model (see supplementary model description in Data S1). Arrows indicate long-range interactions as in panel A. C. Simulated contact frequencies calculated on the ensemble of fiber configurations obtained by optimizing interaction potentials. The simulation was run with optimal values of parameters R = 1.5 a and rHC = 0.6 a. Bottom: Positions of high-resolution DNA FISH probes. Arrows as in panels A and B. D. High-resolution 3D DNA FISH to validate model predictions on three-dimensional distances within the Tsix TAD. Signals from three 9-kb plasmid probes in a male (E14) ES cell are shown after computational correction of chromatic aberrations. E. Model predictions against experimental measurements for mean 3D distances (left) and standard deviations of 3D distances between seven pairs of loci within the Tsix TAD (colors refer to the probe pairs shown in the bottom part of panel C). Linear fit allows extracting the numerical value of the bead-to-bead distance a as the slope of the best fitting line (a = 53 nm ±2), thus allowing to converting model distances into real physical distances. F. Comparison of full 3D distance distributions predicted by the optimized model and measured in 3D DNA FISH. n>100 cells were quantified for all distances. Colored circles indicate which probe pair the graph refers to, with reference to panel C. G. Sample fiber conformations in the optimized ensemble of configurations. Color encodes the position along the model polymer, from 5′ (blue) to 3′ (red). H. In the optimized ensemble of fiber conformations, Xite/Tsix and Linx tend to be close in space when the entire TAD is in a compact configuration (small gyration radius), and are kept far apart in cells where the TAD is in unfolded configurations.
Figure 3
Figure 3. Identification of master loci controlling long-range contacts within the Tsix TAD
A. Virtual “mutations” were generated by silencing the interaction potentials of single beads with all other beads in the model chain. Structural ensembles were re-simulated without further optimizing the potentials of unaffected beads and used to calculate mutant contact frequencies. B. The similarity between wild-type and “virtual mutant” contact maps was quantified by their Spearman correlation coefficient (small correlation coefficients correspond to big changes in contact frequencies). Hotspots of “master” beads, which strongly affect contact probabilities when mutated, are highlighted in grey. Here, master beads were defined as those corresponding to the lowest 10% quantile of correlation coefficients (see Extended Experimental Procedures). Alignment with ChIP-seq data (Kagey et al., 2010) shows that hotspots overlap with cohesin (Smc1 and Smc3) and CTCF binding sites (p<0.005, see Extended Experimental Procedures). C. Silencing the interaction potentials of single beads in the Linx and Xite/Tsix hotspots causes the loss of long-range contacts between Linx and Xite/Tsix (indicated by an arrow) as well as a global decrease in contact frequencies throughout the Tsix TAD. Numbers indicate the index of beads that were mutated in the examples shown here. D. Silencing interaction potentials in the Chic1 hotspot also causes the loss of long-range interaction between Linx and Xite/Tsix (arrow). E. Simultaneously silencing interaction potentials of all beads in the four hotspots causes the internal organization of long-range contacts within the Tsix TAD to be lost. F. Generation of mutant male ES cells bearing a 4.4-kb deletion within the Chic1 hotspot (Δ63-64). Two pairs of TALENs were designed to induce double-strand breaks flanking two cohesin/CTCF binding sites that overlap with beads 63 (partly), and 64 (pairs of TALENs are shown here by scissors). Two clones (55.13 and 88.12) bearing a full deletion of the 4.4 kb sequence between the two pairs of TALENs were analyzed. G. Left panel: High-resolution 3D DNA FISH in mutant vs. wild-type male ES cells with probes against Linx and Xite/Tsix. DNA FISH was performed in in two independent wild-type samples and two Δ63-64 mutant clones. Right panel, top: Comparison of cumulative distributions revealed that 3D distances between Linx and Xite/Tsix are mildly but significantly larger in mutant than in wild-type cells. Model prediction for mutated bead 63 (cf. panel D) is shown in the inset. Bottom: Comparison of mean 3D distances in individual wild-type and mutant samples (* denotes p<0.05 in one-tailed two-sample Kolmogorov-Smirnov tests; ns denotes p>0.85). On average, Linx-Xite/Tsix 3D distances were 16% ± 3% larger in the Δ63-64 mutants than in wild-type cells in agreement with the model prediction (22%).
Figure 4
Figure 4. Intra-TAD interactions participate in establishing and maintaining boundaries between adjacent TADs
A. Extended model fiber for simulating the Tsix and Xist TADs together (represented in red and green, respectively). B. Experimental and simulated contact frequencies for the Tsix and Xist TADs. The model correctly reproduces the existence of two the TADs and the weak contact frequencies between them. Experimental data from (Nora et al, 2012). C. Sample conformations from the optimized simulation shown in panel B, highlighting the compartmentalization of the model fiber into two separated domains corresponding to the Tsix and Xist TADs despite extensive structural variability. D. The gyration radii of the Xist and Tsix TAD were determined for each single fiber conformation in the optimized simulation, showing no mutual correlation. Color scale in the plot corresponds to the percentage of simulated fiber configurations wherein the gyration radius of the Tsix and Xist lie in each corresponding 50 nm × 50 nm bin. E. Experimental data (from Nora et al., 2012) and model prediction of contact frequencies in the ΔXTX boundary deletion. No further potential optimization with respect to the model shown in panel C was performed. Arrow indicates the position of the ectopic boundary near the Ftx promoter. The model correctly predicts the formation of new boundary between regions 1 and 2 of the contact map, the experimental increase in inter-TAD contact frequencies in regions 1 and 2 and the stability of contacts within the Xist TAD (region 3). F. Silencing interaction potentials of single beads within hotspots in the Tsix TAD (beads 26, 63 and 88 are shown here as examples) leads to four-fold increased contacts between the Tsix and Xist TADs, as shown by the right-hand side heatmaps. G. Demarcation of the boundary between TADs is decreased when silencing the interaction potentials of single beads in the Tsix TAD hotspots (beads 63 and 88 shown here as an example). Contact frequencies from multiple viewpoints within the Tsix TAD (red arrowhead, bottom panel) were averaged and plotted against genomic distance to generate the interaction profile in the top panel. Loss of contacts within the Tsix TAD near the boundary (arrow) is at the origin of increased boundary permeability.
Figure 5
Figure 5. Structural fluctuations at the Tsix TAD are coupled with fluctuations in transcription of Tsix and Linx
A. Clustering of fiber configurations in the Tsix TAD. Hierarchical clustering of model fiber configurations based on their structural dissimilarity (dRMSD between structures) predicts the coexistence of two conformational classes. Compact conformations are enriched in long-range physical contacts, which are virtually absent in elongated structures. B. Sequential quantitative RNA/3D DNA FISH allows measuring nascent transcription and TAD compaction in the same cells. Top: Positions of RNA and DNA FISH probes in the Tsix TAD. Middle panel: RNA FISH for Tsix and Linx nascent transcripts in a PGK12.1 female cell showing differential transcription from the two alleles. Bottom panel: sequential 3D DNA FISH in the same cell with the two adjacent BAC probes shown on top; DNA FISH images were acquired by structured illumination microscopy. C. Single-cell analysis of differential allelic transcription of Tsix and Linx vs. differential allelic TAD volume in female PGK12.1 cells. Tsix (left) tends to be more transcribed from the most compact TAD, whereas Linx (right) shows the inverse trend. Cells were sorted in the G1 phase of the cell cycle, where one copy of the chromatin fiber is present on each allele, to ensure unequivocal quantification of transcription and TAD volume.
Figure 6
Figure 6. Statistical fluctuations within the Tsix TAD may contribute to the establishment of asymmetric Tsix expression at the onset of XCI
A. Interactions between the Linx, Chic1 and Xite/Tsix hotspots shape the structure of the Tsix TAD by favoring conformations of the chromatin fiber wherein they mutually colocalise. Three conformations representative of pairwise or three-some interactions between hotspots are shown, taken from the optimized model of the Tsix TAD. B. Statistical fluctuations in chromatin conformation within the Tsix TAD may contribute to ensuring asymmetric expression from the Xic at the onset of X chromosome inactivation (XCI). In cells where the Tsix TAD is similarly compacted on the two alleles (cell A), Tsix and Linx tend to be similarly transcribed from the two alleles, whereas in cells where the Tsix TADs is significantly more compacted on one allele (as in cells B and C) the two transcripts tend to be differentially expressed. This mechanism may help ensuring that Xist is only transcribed from the allele with lower Tsix transcription at the onset of XCI.

Comment in

  • Chromosomes: Dynamically in the loop.
    Burgess DJ. Burgess DJ. Nat Rev Genet. 2014 Jul;15(7):440. doi: 10.1038/nrg3762. Epub 2014 May 20. Nat Rev Genet. 2014. PMID: 24840553 No abstract available.

References

    1. Amano T, Sagai T, Tanabe H, Mizushina Y, Nakazawa H, Shiroishi T. Chromosomal Dynamics at the Shh Locus: Limb Bud-Specific Differential Regulation of Competence and Active Transcription. Dev Cell. 2009;16:47–57. - PubMed
    1. Andrey G, Montavon T, Mascrez B, Gonzalez F, Noordermeer D, Leleu M, Trono D, Spitz F, Duboule D. A Switch Between Topological Domains Underlies HoxD Genes Collinearity in Mouse Limbs. Science. 2013;340:1234167. - PubMed
    1. Baù D, Marti-Renom MA. Structure determination of genomic domains by satisfaction of spatial restraints. Chromosome Res. 2010;19:25–35. - PubMed
    1. Chaumeil J, Augui S, Chow JC, Heard E. Combined Immunofluorescence, RNA Fluorescent In Situ Hybridization, and DNA Fluorescent In Situ Hybridization to Study Chromatin Changes, Transcriptional Activity, Nuclear Organization, and X-Chromosome Inactivation. In: Hancock R, editor. The Nucleus. Totowa, NJ: Humana Press; 2008. pp. 297–308. - PubMed
    1. Debrand E, Chureau C, Arnaud D, Avner P, Heard E. Functional Analysis of the DXPas34 Locus, a 3′ Regulator of Xist Expression. Mol Cell Biol. 1999;19:8513–8525. - PMC - PubMed

Publication types

LinkOut - more resources