. 2014 May 22;7(4):1239-47.
doi: 10.1016/j.celrep.2014.04.015. Epub 2014 May 9.

The histone methyltransferase activity of MLL1 is dispensable for hematopoiesis and leukemogenesis

Affiliations

The histone methyltransferase activity of MLL1 is dispensable for hematopoiesis and leukemogenesis

Bibhu P Mishra et al. Cell Rep. .

Abstract

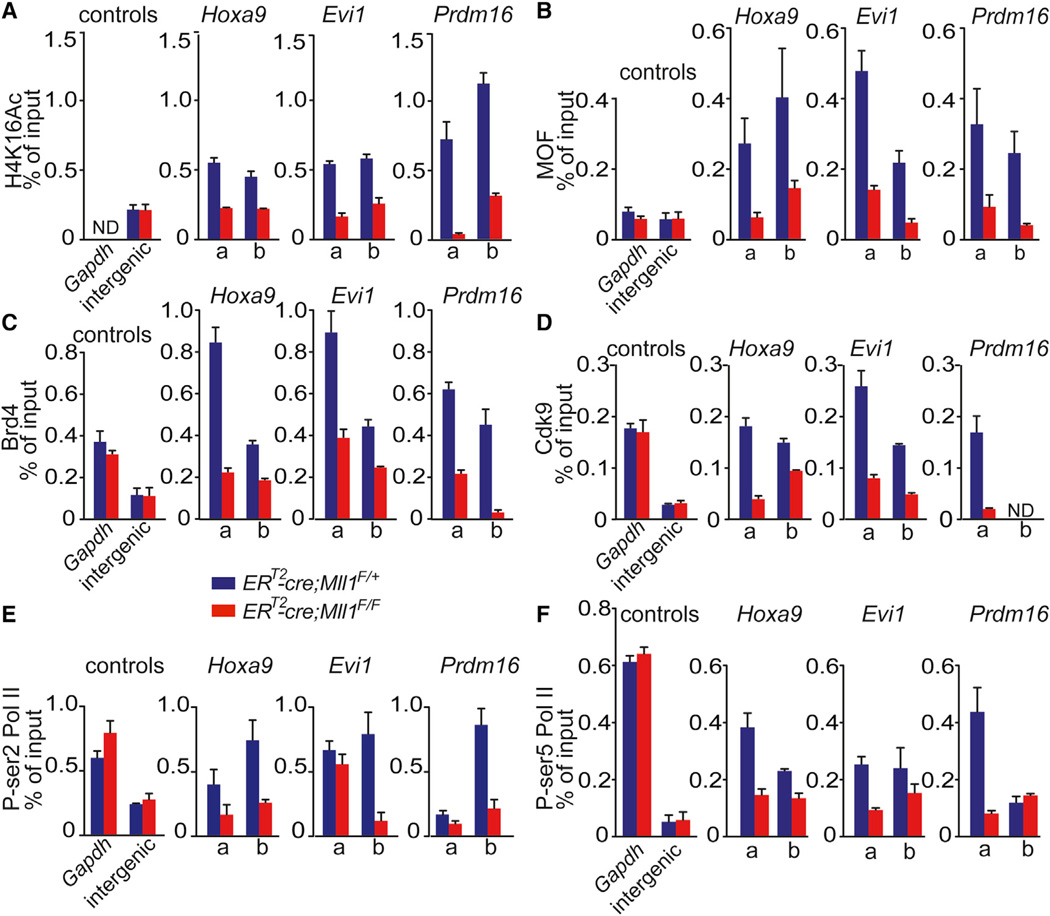
Despite correlations between histone methyltransferase (HMT) activity and gene regulation, direct evidence that HMT activity is responsible for gene activation is sparse. We address the role of the HMT activity for MLL1, a histone H3 lysine 4 (H3K4) methyltransferase critical for maintaining hematopoietic stem cells (HSCs). Here, we show that the SET domain, and thus HMT activity of MLL1, is dispensable for maintaining HSCs and supporting leukemogenesis driven by the MLL-AF9 fusion oncoprotein. Upon Mll1 deletion, histone H4 lysine 16 (H4K16) acetylation is selectively depleted at MLL1 target genes in conjunction with reduced transcription. Surprisingly, inhibition of SIRT1 is sufficient to prevent the loss of H4K16 acetylation and the reduction in MLL1 target gene expression. Thus, recruited MOF activity, and not the intrinsic HMT activity of MLL1, is central for the maintenance of HSC target genes. In addition, this work reveals a role for SIRT1 in opposing MLL1 function.


Figures

Figure 1
Figure 1. Normal HSC Number, Function, and Gene Expression in ΔSET Animals
(A–C) LSK cells were quantified from littermates of 3–4 weeks (A), 5–9 weeks (B), or 6–8 months old (C) n = 3–7 animals for each genotype. The cell number on the y axis reflects total number per two hindlimbs. (D) Representative fluorescence-activated cell sorting plots of LSK-gated cells. (E) Total LSK/CD150+/CD48neg cells per two hindlimbs, n = 5–6 animals per genotype at 4–6 weeks of age. (F) CRU quantification for bone marrow from WT or ΔSET animals, n = 3–7 recipients and three donors per cell dose. Inset table shows mean CRU ± range, determined using L-Calc software. (G) Expression of MLL1 target genes in WT or ΔSET LSK cells. LSK cells were sorted from the bone marrow of 6- to 12-week-old animals, n = 5–6 per genotype. Error bars reflect mean gene expression level per donor animal ±95% confidence interval.
Figure 2
Figure 2. MLL-AF9 AML Is Initiated and Propagated Normally in ΔSET Hematopoietic Cells
(A) Kaplan-Meier plot of primary leukemia in recipients transplanted with MLL-AF9-transduced WT or ΔSET bone marrow cells, n = 9 per genotype. (B) Phenotypic analysis of leukemia cells from tissues of moribund animals. Cells from the indicated organs were stained with Mac-1 and Gr-1 antibodies and YFP+-gated cells shown. (C and D) Automated differential counts were determined using peripheral blood cells from leukemic animals (n = 9 per genotype) and age-matched controls (n = 2). White blood cells (WBCs, C) and red blood cells (RBC, D) are shown from the 18 animals represented in (A). (E) Spleen weight of leukemic animals when moribund and control animals as in (C) and (D). (F) Secondary transplantation results using 100 (solid lines) or 1,000 (dashed lines) YFP+ leukemia cells, n = 4 recipients per genotype. (G) MLL-AF9-transformed cells exhibit similar serial replating activity in vitro. Leukemia cells from primary recipients were plated in methylcellulose medium and colonies quantified and replated every week, corresponding to the replating number below the pairs of bars. Data represent means of triplicate reactions ±SD.
Figure 3
Figure 3. Loss of MLL1 in Hematopoietic Cells Does Not Affect H3K4me Enrichment at Target Genes
(A) Transcripts corresponding to three representative MLL1 target genes decrease rapidly upon 4-OHT-induced excision of Mll1 in vitro. Linneg cells were purified from control ERT2-cre;Mll1F/+ or ERT2-cre;Mll1F/F bone marrow and were cultured in vitro in medium containing 400 nM4-OHT. Triplicate samples were harvested every 12 hr for real-time qPCR (A) and ChIP (C–E) assays. (B) Diagram of target gene loci showing ChIP amplicon location, approximately 1 kb to either side of the TSS (see Table S1). (C–E) Anti-H3K4me1, -H3K4me2, and -H3K4me3 ChIP assays were performed using samples from the 48 hr time point. Enrichment of the indicated histone modification is shown for each amplicon as the mean of four PCRs ±SEM. ChIP results are representative of at least three independent experiments.
Figure 4
Figure 4. Genome-wide Comparison of H3K4me1 and H3K4me3 Enrichment in Purified Mll1Δ/Δ HSPCs
(A) Representative ChIP-seq tracks showing reads per million (y axis). LSK cells were sorted from control ERT2-cre;Mll1F/+ or ERT2-cre;Mll1F/F animals and cultured in vitro in HSC medium 48 hr (300 nM 4-OHT for only the first 24 hr). Complete deletion of Mll1 was confirmed (Figure S4B). The locus is diagrammed below the tracks. (B and C) Scatterplots showing the concordance between enriched regions in a representative pair of control versus Mll1Δ/Δ samples. Each dot represents enrichment of the indicated histone modification within a bin of 1 kb. Differentially enriched bins in control Mll1Δ/+ LSK cells are shown in green and those enriched in Mll1Δ/Δ LSK cells are shown in red. Pairwise comparisons between different replicate pairs yielded similar results and concordance between replicates is shown in Figures S4C–S4E.
Figure 5
Figure 5. MOF-Mediated H4K16 Acetylation Parallels MLL1 Target Gene Expression
ChIP assays performed 48 hr after initiating Mll1 deletion as in Figure 3A. Nuclei from linneg cells were fixed and ChIP performed using anti-H4K16Ac (A), -MOF (B), -Brd4 (C), -Cdk9 (D), -phospho-ser2 Pol II (E), and phospho-ser5 Pol II (F). Amplicons are as diagrammed in Figure 3B. Data represent mean of two to four replicates ±SEM and are representative of at least three experiments. ND, not determined.
Figure 6
Figure 6. Restoration of MLL1 Target Expression and H4K16 Acetylation by SIRT1 Inhibition
ERT2-cre;Mll1F/+ or ERT2-cre;Mll1F/F cells were cultured as in Figure 3A to initiate Mll1 deletion. Duplicate ERT2-cre;Mll1F/F samples were incubated with both 4-OHT and either 25 mM Ex-527 (A) or 5 mM nicotinamide (B). After 48 or 60 hr, Mll1 target gene expression was determined by real-time qPCR. Means of four PCRs ±SEM are shown. Data are representative of two to three independent experiments.

References

    1. Andreu-Vieyra CV, Chen R, Agno JE, Glaser S, Anastassiadis K, Stewart AF, Matzuk MM. MLL2 is required in oocytes for bulk histone 3 lysine 4 trimethylation and transcriptional silencing. PLoS Biol. 2010;8 - PMC - PubMed
    1. Artinger EL, Mishra BP, Zaffuto KM, Li BE, Chung EK, Moore AW, Chen Y, Cheng C, Ernst P. An MLL-dependent network sustains hematopoiesis. Proc. Natl. Acad. Sci. USA. 2013;110:12000–12005. - PMC - PubMed
    1. Attema JL, Papathanasiou P, Forsberg EC, Xu J, Smale ST, Weissman IL. Epigenetic characterization of hematopoietic stem cell differentiation using miniChIP and bisulfite sequencing analysis. Proc. Natl. Acad. Sci. USA. 2007;104:12371–12376. - PMC - PubMed
    1. Austenaa L, Barozzi I, Chronowska A, Termanini A, Ostuni R, Prosperini E, Stewart AF, Testa G, Natoli G. The histone methyltransferase Wbp7 controls macrophage function through GPI glycolipid anchor synthesis. Immunity. 2012;36:572–585. - PubMed
    1. Cao F, Chen Y, Cierpicki T, Liu Y, Basrur V, Lei M, Dou Y. An Ash2L/RbBP5 heterodimer stimulates the MLL1 methyltransferase activity through coordinated substrate interactions with the MLL1 SET domain. PLoS ONE. 2010;5:e14102. - PMC - PubMed

Publication types

MeSH terms

Associated data