. 2014 Sep;272(3):731-8.
doi: 10.1148/radiol.14132732. Epub 2014 May 7.

Breast tissue characterization with photon-counting spectral CT imaging: a postmortem breast study

Affiliations

Breast tissue characterization with photon-counting spectral CT imaging: a postmortem breast study

Huanjun Ding et al. Radiology. 2014 Sep.

Abstract

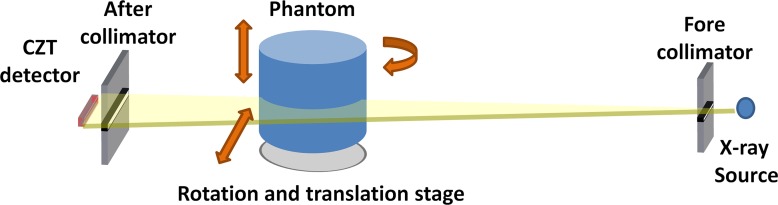
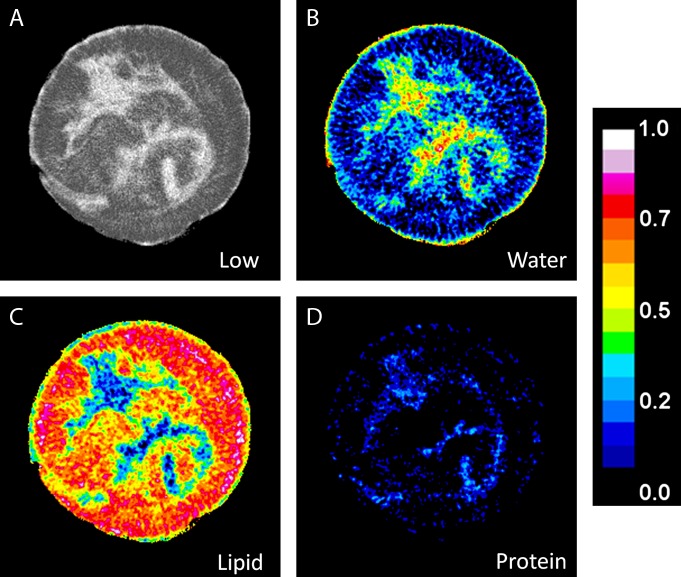
Purpose: To investigate the feasibility of breast tissue characterization in terms of water, lipid, and protein contents with a spectral computed tomographic (CT) system based on a cadmium zinc telluride (CZT) photon-counting detector by using postmortem breasts.

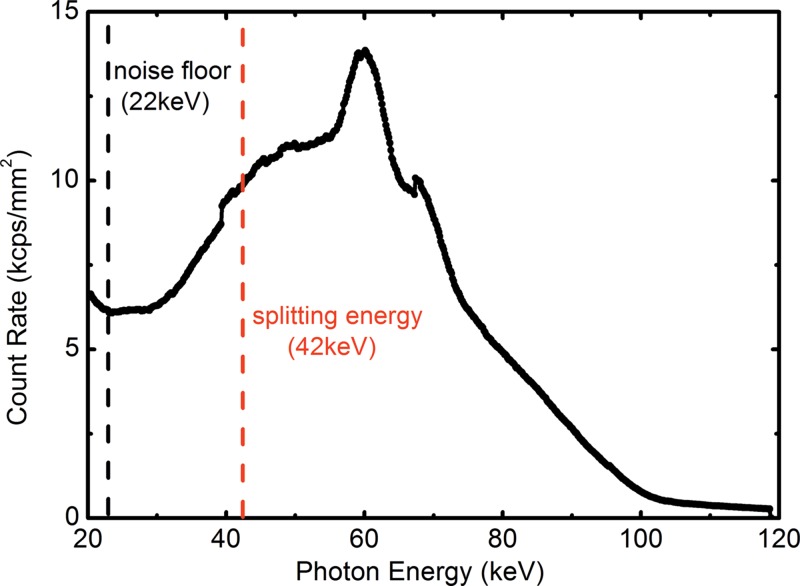
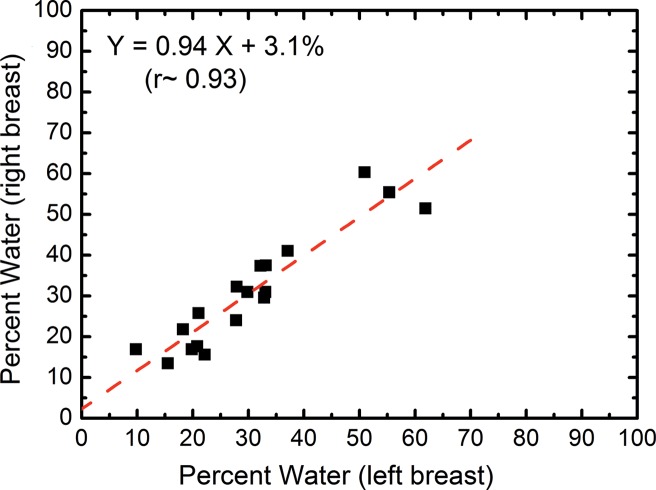
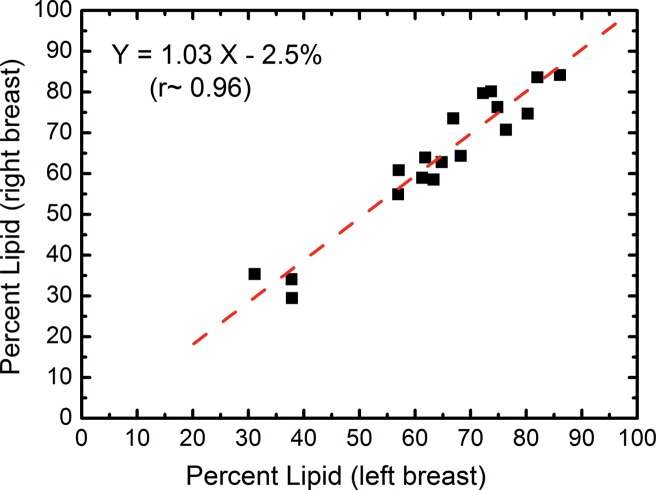
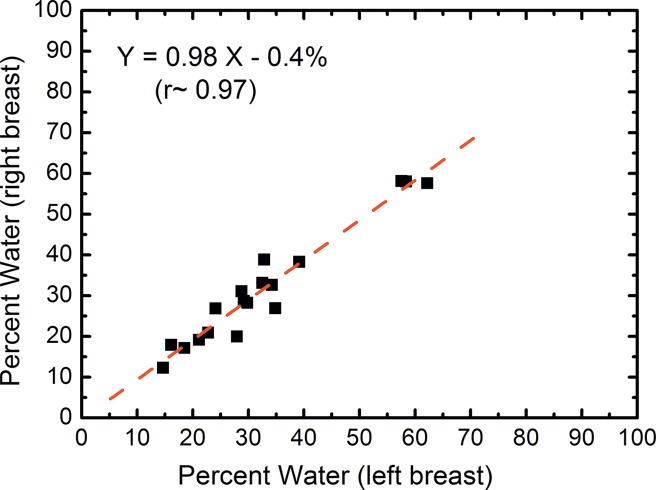
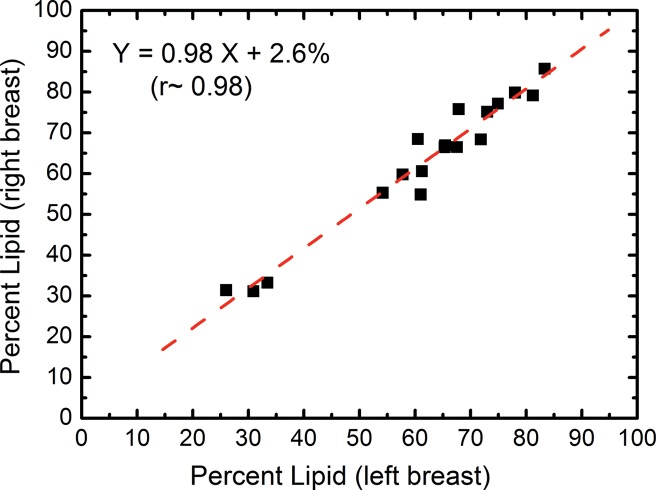
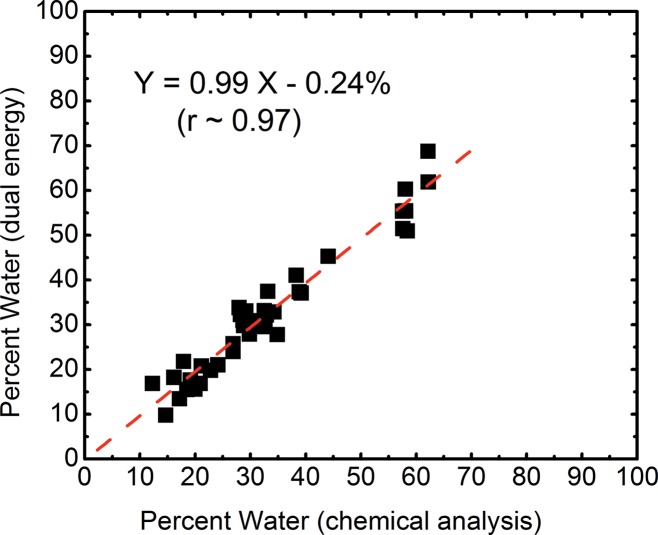
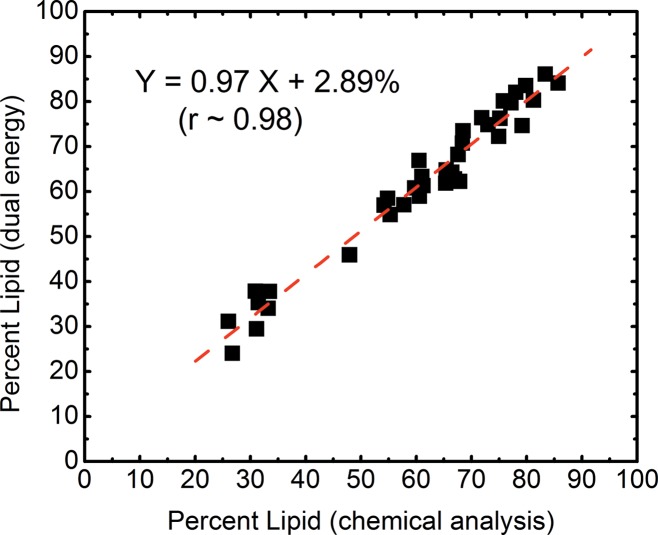
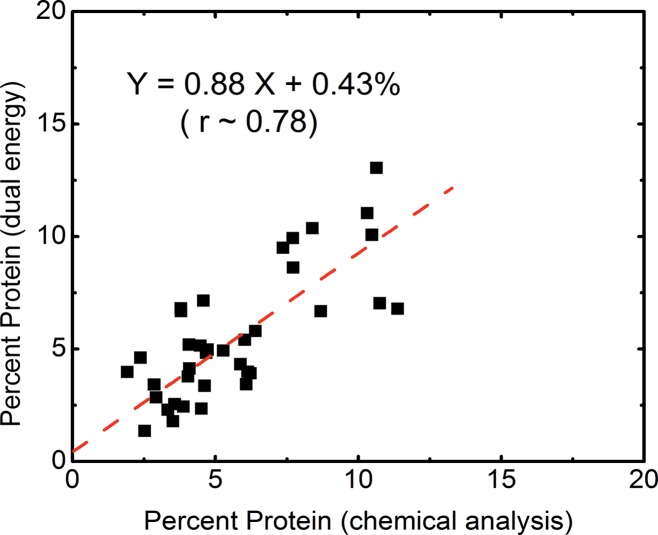
Materials and methods: Nineteen pairs of postmortem breasts were imaged with a CZT-based photon-counting spectral CT system with beam energy of 100 kVp. The mean glandular dose was estimated to be in the range of 1.8-2.2 mGy. The images were corrected for pulse pile-up and other artifacts by using spectral distortion corrections. Dual-energy decomposition was then applied to characterize each breast into water, lipid, and protein contents. The precision of the three-compartment characterization was evaluated by comparing the composition of right and left breasts, where the standard error of the estimations was determined. The results of dual-energy decomposition were compared by using averaged root mean square to chemical analysis, which was used as the reference standard.

Results: The standard errors of the estimations of the right-left correlations obtained from spectral CT were 7.4%, 6.7%, and 3.2% for water, lipid, and protein contents, respectively. Compared with the reference standard, the average root mean square error in breast tissue composition was 2.8%.

Conclusion: Spectral CT can be used to accurately quantify the water, lipid, and protein contents in breast tissue in a laboratory study by using postmortem specimens.


Figures

Figure 1:
Figure 1:
A schematic of the bench-top photon-counting spectral CT system.
Figure 2:
Figure 2:
Graph shows experimentally measured tungsten anode spectrum at 100 kVp. The electronic noise floor and the splitting threshold between the low- and high-energy bins were noted as dashed lines at 22 and 42 keV, respectively.
Figure 3:
Figure 3:
A, Low-energy CT image of a postmortem breast, and the corresponding decomposition images for, B, water, C, lipid, and, D, protein. The color scale represents the absolute volumetric fraction for different components in a given voxel.
Figure 4a:
Figure 4a:
Scatterplots show the right-left correlation of (a) water and (b) lipid contents measured from spectral CT by using dual-energy decomposition and (c, d) from chemical analysis. Linear fittings for all three contents are shown with dashed lines, which are in good agreement with the identity line.
Figure 4b:
Figure 4b:
Scatterplots show the right-left correlation of (a) water and (b) lipid contents measured from spectral CT by using dual-energy decomposition and (c, d) from chemical analysis. Linear fittings for all three contents are shown with dashed lines, which are in good agreement with the identity line.
Figure 4c:
Figure 4c:
Scatterplots show the right-left correlation of (a) water and (b) lipid contents measured from spectral CT by using dual-energy decomposition and (c, d) from chemical analysis. Linear fittings for all three contents are shown with dashed lines, which are in good agreement with the identity line.
Figure 4d:
Figure 4d:
Scatterplots show the right-left correlation of (a) water and (b) lipid contents measured from spectral CT by using dual-energy decomposition and (c, d) from chemical analysis. Linear fittings for all three contents are shown with dashed lines, which are in good agreement with the identity line.
Figure 5a:
Figure 5a:
Scatterplots show correlations of the volumetric fractions of (a) water, (b) lipid, and (c) protein contents derived from dual-energy images and chemical analysis. Linear fittings for all three components are shown with dashed lines, which are in good agreement with the identity line.
Figure 5b:
Figure 5b:
Scatterplots show correlations of the volumetric fractions of (a) water, (b) lipid, and (c) protein contents derived from dual-energy images and chemical analysis. Linear fittings for all three components are shown with dashed lines, which are in good agreement with the identity line.
Figure 5c:
Figure 5c:
Scatterplots show correlations of the volumetric fractions of (a) water, (b) lipid, and (c) protein contents derived from dual-energy images and chemical analysis. Linear fittings for all three components are shown with dashed lines, which are in good agreement with the identity line.

References

    1. Sala M, Comas M, Macià F, Martinez J, Casamitjana M, Castells X. Implementation of digital mammography in a population-based breast cancer screening program: effect of screening round on recall rate and cancer detection. Radiology 2009;252(1):31–39. - PubMed
    1. Zare Z, Faghihi Langroudi T. Findings of breast sonography in patients with foal asymmetric breast density on mammography. Iran Red Crescent Med J 2011;13(6):404–406. - PMC - PubMed
    1. Shin HJ, Kim HH, Ahn JH, et al. . Comparison of mammography, sonography, MRI and clinical examination in patients with locally advanced or inflammatory breast cancer who underwent neoadjuvant chemotherapy. Br J Radiol 2011;84(1003):612–620. - PMC - PubMed
    1. Houssami N, Miglioretti DL. Early detection of breast cancer the second time around: mammography in women with a personal history of breast cancer. Med J Aust 2011;194(9):439–440. - PubMed
    1. Feig S. Comparison of costs and benefits of breast cancer screening with mammography, ultrasonography, and MRI. Obstet Gynecol Clin North Am 2011;38(1):179–196, ix. - PubMed