. 2014 Jun 3;19(6):1042-9.
doi: 10.1016/j.cmet.2014.04.001. Epub 2014 May 8.

NAD(+)-dependent activation of Sirt1 corrects the phenotype in a mouse model of mitochondrial disease

Affiliations

NAD(+)-dependent activation of Sirt1 corrects the phenotype in a mouse model of mitochondrial disease

Raffaele Cerutti et al. Cell Metab. .

Abstract

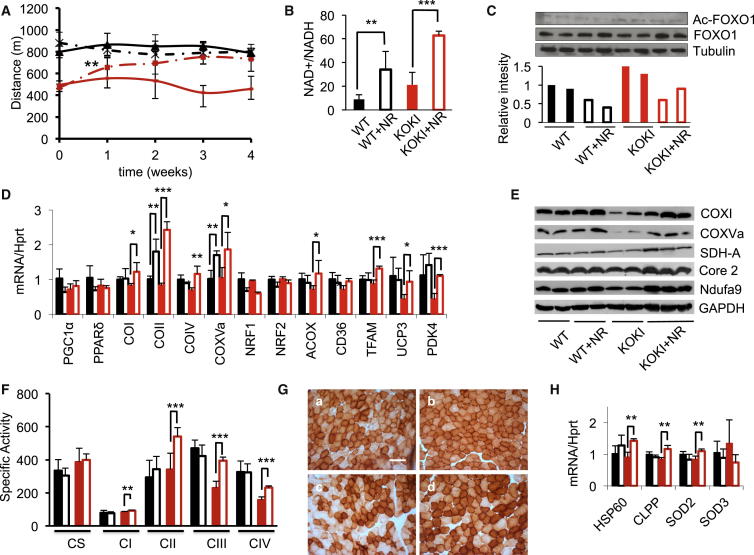
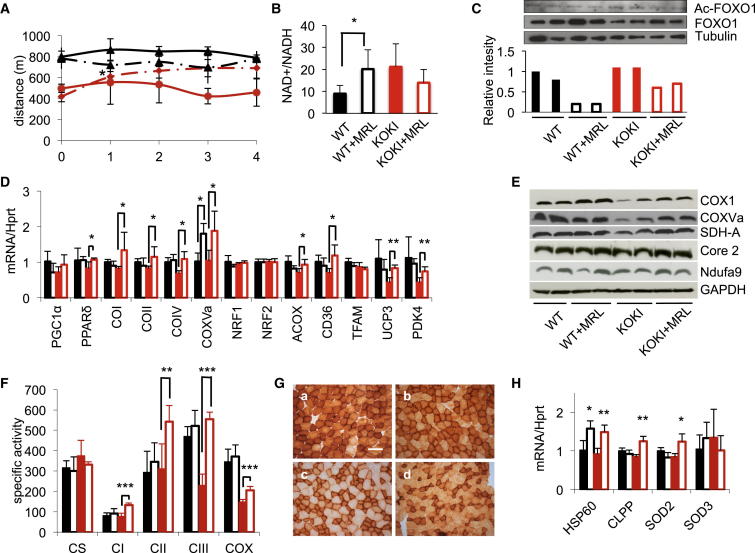
Mitochondrial disorders are highly heterogeneous conditions characterized by defects of the mitochondrial respiratory chain. Pharmacological activation of mitochondrial biogenesis has been proposed as an effective means to correct the biochemical defects and ameliorate the clinical phenotype in these severely disabling, often fatal, disorders. Pathways related to mitochondrial biogenesis are targets of Sirtuin1, a NAD(+)-dependent protein deacetylase. As NAD(+) boosts the activity of Sirtuin1 and other sirtuins, intracellular levels of NAD(+) play a key role in the homeostatic control of mitochondrial function by the metabolic status of the cell. We show here that supplementation with nicotinamide riboside, a natural NAD(+) precursor, or reduction of NAD(+) consumption by inhibiting the poly(ADP-ribose) polymerases, leads to marked improvement of the respiratory chain defect and exercise intolerance of the Sco2 knockout/knockin mouse, a mitochondrial disease model characterized by impaired cytochrome c oxidase biogenesis. This strategy is potentially translatable into therapy of mitochondrial disorders in humans.


Figures

None
Graphical abstract
Figure 1
Figure 1
Characterization of Parp1−/−-Sco2KOKI Double Mutants (A) Treadmill analysis of motor performance. Solid black, WT; dashed black, Parp1−/−; solid red, Sco2KOKI; dashed red, Parp1−/−-Sco2KOKI. The asterisks represent the significance levels calculate by unpaired, two-tailed Student’s t test; ∗∗∗p < 0.001. (B) MRC activities (nmoles/min/mg of protein) in skeletal muscle. Solid black, WT; black outline, Parp1−/−; solid red, Sco2KOKI; red outline, Parp1−/−-Sco2KOKI. CS, citrate synthase; CI-IV, MRC complexes I–IV. Error bars represent the standard deviation (SD). Unpaired, two-tailed Student’s t test; p < 0.05; ∗∗p < 0.01; ∗∗∗p < 0.001. (C) COX staining in skeletal muscle of WT (Ca), Parp1−/− (Cb), Sco2KOKI (Cc), and Sco2KOKI-Parp1−/− mice (Cd). Note the increased COX staining in the double mutants. Scale bar, 100 μm. (D) MRC activities in the brain. Color codes as in (B). Error bars represent the standard deviation (SD). Unpaired, two-tail Student’s t test; ∗∗p < 0.01; ∗∗∗p < 0.001. (E) COX staining in the brain of WT (Ea), Parp1−/− (Eb), Sco2KOKI (Ec), and Sco2KOKI-Parp1−/− mice (Ed). Scale bar, 100 μm.
Figure 2
Figure 2
Effect of NR in Skeletal Muscle (A) Treadmill analysis of motor performance. Solid black, vehicle-treated WT; dashed black, NR-treated WT; dashed red, vehicle-treated Sco2KOKI; solid red, vehicle-treated Sco2KOKI; dashed red, NR-treated Sco2KOKI. Paired, two-tailed Student’s t test, ∗∗p < 0.01. (B) NAD+ concentration in skeletal muscle. Solid black, vehicle-treated WT; black outline, NR-treated WT; solid red, vehicle-treated Sco2KOKI; red outline, NR-treated Sco2KOKI. Error bars represent SD. Unpaired, two-tailed Student’s t test; p < 0.05; ∗∗p < 0.01. (C) Analysis of acetylation of FOXO1. (Upper panel) Representative western blot immunovisualization. (Lower panel) Densitometric analysis. Note that both WT and Sco2KOKI samples showed reduced acetylation and increased total FOXO1 upon NR treatment, indicating activation of Sirt1. Tubulin was taken as loading control. Color codes as in (B). (D) Analysis of mRNA expression of FAO- and OXPHOS-related genes in Sco2KOKI and WT muscles of NR-treated and vehicle-treated mice. Color codes as in (B). Gene transcripts, retrotranscribed into cDNA, were normalized to the Hprt gene transcript, taken as a standard, and expressed as time fold variation relative to the WT. Error bars represent SD. Unpaired, two-tailed Student’s t test; p < 0.05; ∗∗p < 0.01; ∗∗∗p < 0.001. (E) Western blot immunovisualization of COX1, COXVa, SDH 70KDa, Core 2, 39 KDa complex I subunit proteins in skeletal muscle of NR-treated and vehicle-treated mice of the different genotypes. Note the increased amount of respiratory chain subunits in NR-treated Sco2KOKI samples. (F) MRC activities (nmoles/min/mg of protein). Color codes as in (B). CS, citrate synthase; CI-IV, MRC complexes I–IV. Error bars represent SD. Unpaired, two-tail Student’s t test; ∗∗p < 0.01; ∗∗∗p < 0.001. (G) COX staining in skeletal muscles of (Ga) vehicle-treated WT, (Gb) NR-treated WT, (Gc) vehicle-treated Sco2KOKI, and (Gd) NR-treated Sco2KOKI. Scale bar, 100 μm. (H) mRNA expression analysis of mtUPR genes Hsp60, Clpp, and Sod2 in Sco2KOKI and WT muscles of NR-treated and vehicle-treated mice. Sod3 was taken as a non-mtUPR-related stress protein. Color codes as in (B). Gene transcripts, retrotranscribed into cDNA, were normalized to that of the Hprt gene transcript, taken as a standard, and expressed as time fold variation relative to the WT. Error bars represent SD. Unpaired, two-tailed Student’s t test; ∗∗p < 0.01.
Figure 3
Figure 3
Effects of MRLB-45696 on the Skeletal Muscle (A) Treadmill analysis of motor performance. Solid black, vehicle-treated WT; dashed black, MRLB-45696-treated WT; dashed red, vehicle-treated Sco2KOKI; solid red, vehicle-treated Sco2KOKI; dashed red, MRLB-45696-treated Sco2KOKI. Paired, two-tailed Student’s t test; ∗∗p < 0.01. (B) NAD+ concentration in skeletal muscle. Solid black, vehicle-treated WT; black outline, MRLB-45696-treated WT; solid red, vehicle-treated Sco2KOKI; red outline, MRLB-45696-treated Sco2KOKI. Error bars represent SD. Unpaired, two-tailed Student’s t test; p < 0.05. (C) Analysis of acetylation of FOXO1. Both WT and Sco2KOKI samples showed reduced acetylation and increased total FOXO1 upon MRLB-45696 treatment, indicating activation of Sirt1. Tubulin was taken as loading control. Densitometric analysis is presented in Table S3. (D) mRNA expression analysis of FAO- and OXPHOS-related genes in Sco2KOKI and WT muscles of NR-treated and vehicle-treated mice. Solid black, vehicle-treated WT; black outline, MRLB-45696-treated WT; solid red, vehicle-treated Sco2KOKI; red outline, MRLB-45696-treated Sco2KOKI. Gene transcripts, retrotranscribed into cDNA, were normalized to the Hprt gene transcript, taken as a standard, and expressed as time fold variation relative to the WT. Error bars represent SD. Unpaired, two-tailed Student’s t test; p < 0.05; ∗∗p < 0.01; ∗∗∗p < 0.001. (E) Western blot immunovisualization of COX1, COXVa, SDH 70KDa, Core 2, 39 KDa complex I subunit proteins in skeletal muscle of MRLB-45696-treated and vehicle-treated mice of the different genotypes. Note the increased amount of respiratory chain subunits in MRLB-45696-treated Sco2KOKI samples. (F) Respiratory chain activities (nmoles/min/mg of protein). Color codes as in (B). CS, citrate synthase; CI-IV, MRC complexes I–IV. Error bars represent SD. Unpaired, two-tailed Student’s t test; ∗∗p < 0.01; ∗∗∗p < 0.001. (G) COX staining in skeletal muscles of (Ga) vehicle-treated WT, (Gb) MRLB-45696-treated WT, (Gc) vehicle-treated Sco2KOKI, and (Gd) MRLB-45696-treated Sco2KOKI. Scale bar, 100 μm. (H) mRNA expression analysis of mtUPR genes Hsp60, Clpp, and Sod2 in Sco2KOKI and WT muscles of MRLB-45696-treated and vehicle-treated mice. Sod3 was taken as a non-mtUPR related stress protein. Color codes as in (B). The levels of the gene transcripts, retrotranscribed into cDNA, were normalized to that of the Hprt gene transcript, taken as a standard, and expressed as time fold variation relative to the WT. Error bars represent SD. Unpaired, two-tail Student’s t test; ∗∗p < 0.01.
Figure 4
Figure 4
Effect of MRLB-45696 in the Brain (A) mRNA expression analysis in the brain. Solid black, vehicle-treated WT; black outline, MRLB-45696-treated WT; solid red, vehicle-treated Sco2KOKI; red outline, MRLB-45696-treated Sco2KOKI. (B) Respiratory chain activities (nmoles/min/mg of protein). Color codes as in (A). CS, citrate synthase; CI-IV, MRC complexes I–IV. Error bars represent SD. The asterisks represent the significance levels calculated by unpaired, two-tailed Student’s t test; ∗∗p < 0.01; ∗∗∗p < 0.001. (C) COX staining in the brain of MRLB-45696 treated and vehicle-treated Sco2KOKI and WT mice. The arrows indicate Purkinje cells showing increased COX activity. Scale bar, 100 μm.

References

    1. Adamietz P. Poly(ADP-ribose) synthase is the major endogenous nonhistone acceptor for poly(ADP-ribose) in alkylated rat hepatoma cells. Eur. J. Biochem. 1987;169:365–372. - PubMed
    1. Andreux P.A., Houtkooper R.H., Auwerx J. Pharmacological approaches to restore mitochondrial function. Nat. Rev. Drug Discov. 2013;12:465–483. - PMC - PubMed
    1. Bai P., Cantó C., Oudart H., Brunyánszki A., Cen Y., Thomas C., Yamamoto H., Huber A., Kiss B., Houtkooper R.H. PARP-1 inhibition increases mitochondrial metabolism through SIRT1 activation. Cell Metab. 2011;13:461–468. - PMC - PubMed
    1. Bieganowski P., Brenner C. Discoveries of nicotinamide riboside as a nutrient and conserved NRK genes establish a Preiss-Handler independent route to NAD+ in fungi and humans. Cell. 2004;117:495–502. - PubMed
    1. Bugiani M., Invernizzi F., Alberio S., Briem E., Lamantea E., Carrara F., Moroni I., Farina L., Spada M., Donati M.A. Clinical and molecular findings in children with complex I deficiency. Biochim. Biophys. Acta. 2004;1659:136–147. - PubMed

Publication types

MeSH terms