. 2014 Jun 4;82(5):989-1003.
doi: 10.1016/j.neuron.2014.04.014. Epub 2014 May 8.

Transcriptional regulation of enhancers active in protodomains of the developing cerebral cortex

Affiliations

Transcriptional regulation of enhancers active in protodomains of the developing cerebral cortex

Kartik Pattabiraman et al. Neuron. .

Abstract

Elucidating the genetic control of cerebral cortical (pallial) development is essential for understanding function, evolution, and disorders of the brain. Transcription factors (TFs) that embryonically regulate pallial regionalization are expressed in gradients, raising the question of how discrete domains are generated. We provide evidence that small enhancer elements active in protodomains integrate broad transcriptional information. CreER(T2) and GFP expression from 14 different enhancer elements in stable transgenic mice allowed us to define a comprehensive regional fate map of the pallium. We explored transcriptional mechanisms that control the activity of the enhancers using informatics, in vivo occupancy by TFs that regulate cortical patterning (CoupTFI, Pax6, and Pbx1), and analysis of enhancer activity in Pax6 mutants. Overall, the results provide insights into how broadly expressed patterning TFs regulate the activity of small enhancer elements that drive gene expression in pallial protodomains that fate map to distinct cortical regions.


Figures

Figure 1
Figure 1
Enhancer activity assays at E11.5 of transient transgenics expressing p-galactosidase from the LacZ gene. *: Stable transgenic lines were made using these enhancers. Coronal sections across the rostrocaudal telencephalon studied for 15 different enhancers. A) Five enhancers with a nested pattern of LacZ expression in the dorsal pallium. B) Five enhancers with a nested pattern of LacZ expression in the latero-ventral pallium. C) Five enhancers with a nested pattern of LacZ expression in the medial pallium. D) Schema of coronal sections across the rostrocaudal telencephalon showing progenitor domains and boundaries deduced from analysis of enhancer-driven expression patterns. E) Schema of coronal sections across the rostrocaudal telencephalon showing progenitor domains and boundaries (A-M) deduced from analysis of enhancer activity fate mapping (see subsequent Figures). Some boundaries are specific to rostral (r), whereas other boundaries are specific to caudal (c) regions. See also Figure S1. Abbreviations: see legend to Figure 2.
Figure 2
Figure 2
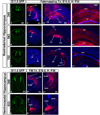
Enhancer activity (GFP expression, E11.5 (panels A-H, A’-H’) and fate mapping (Cre induced tdTomato, E17.5; panels J-R; J’-R’) assays of stable transgenics encoding enhancer 643 (left) or 1050 (right). Panels C and E” show higher magnification view of E11.5 expression. I,I’: Schemas showing approximate position of GFP expression (grey) within flatten view of E11.5 pallial progenitor zones. S,S”: Schemas showing approximate position of dtTomato expression within flatten view of E17.5 pallial subdivisions; color coded according to approximate density of tdTomato+ cells. Abbreviations according to region: Ventral Pallium (VPall, allopallium); AO: anterior olfactory nuclei; OB: olfactory bulb; Pir/EPir; piriform and ectopiriform; LERh: lateral entorhinal; MERh: medial entorhinal. Lateral Pallium (LPall, mesopallium): Ins/Cl: insula/claustrum; LO: lateral orbital; PRh: perirhinal; Orb: orbitofrontal. Dorsal Pallium (DPall; neopallium): AU (A); auditory; DPF: dorsal prefrontal; F: frontal; LPF: lateral prefrontal; M: motor; SS: somatosensory; V: visual. Dorsomedial Pallium (DMPall): Cing (C): cingulate gyrus; IL: infralimbic (and PrL: prelimbic); MOrb: medial orbital; RSP: retrosplenial; PoRh: postrhinal. Medial Pallium (MPall): CA1-3: CA fields 1–3; DG: dentate gyrus; fi (F); fimbria; IG: indusium griseum; Sub (S): subiculum; PaS: parasubiculm; PrS: presubiculum; TT: tenia tecta. Dorsal Midline: bac: brachium of the anterior commissure; bcc: brachium of the corpus callosum; bhc: brachium of the hippocampal commissure; ch; choroid plexus; PSe (PS): pallial septum. Pallial Amygdala (Pall Amygd): AA: anterior amygdala; Ahi: amygdalohippocampal area; BM: basomedial; BLA; basolateral; LA: lateral. Subpallium: Acb: accumbens; CGE: caudal ganglionic eminence; Dg: Diagonal area; LGE: lateral ganglionic eminence; MGE: medial ganglionic eminence; Pal: pallidum; SPSe: subpallial septum; St: striatum. Hypothalamus: hp1, 2: hypothalamic prosomere 1 and 2; PHy: peduncular; Thy: hypothalamus. Diencephalon: Hb; habenula; p2, p3: prosomeres 2 and 3; Thy: terminal hypothalamus; PThE: prethalamic eminence; Th: thalamus.
Figure 3
Figure 3
Eight enhancers with activity in pallial progenitors that fate map to prefrontal cortex subdivisions: medial: 192, 1056, 348; dorsal: 1050, 840; lateral: 636, 281, 1172. Coronal sections through prefrontal cortex are shown: left column shows GFP expression at E11.5 in situ or immunohistochemistry. Right columns shows fate mapping with tdTomato expression in an E17.5 rostrocaudal series. See Figure S2 for additional E11.5 and E17.5 sections. I: Annotation of fate mapping results from selected enhancers (y axis) in five regions of the frontal cortex (x axis). Different levels of density of tdTomato expression are estimated and described as high density (red), medium density (orange), low density (yellow) and negligible density (green). In some cases we note subdomain expression. J: Deduced progenitor domain organization of the rostral E11.5 pallium. Abbreviations: see legend to Figure 2, and: CR: Cajal Retzius cells; DPFC: dorsal prefrontal; DLGE: dorsal LGE; FP: Frontal pole; MPFC: medial prefrontal; SP; subpallium.
Figure 4
Figure 4
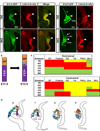
Four enhancers with activity in pallial progenitors that fate map to ventrolateral cortex subdivisions. Left panels show GFP protein (green fluorescence) or RNA (purple in situ) expression at E10.5 (636; arrowhead: migrating neurons), or E11.5 (281, 218). Right columns shows fate mapping with tdTomato expression at E17.5. To map the fate map boundaries, double immunofluorescnece was performed to detect tdTomato (red) and either Nurr1 or Ctip2 (green). Nurr1 or Ctip2 expression was used to define boundaries 1, 2, 3 and 4 (see Results), that distinguished the limits of the fate maps of 636, 281,and 218. J: Annotation of fate mapping results from selected enhancers (y axis) in nine regions of the ventrolateral cortex (x axis). Different levels of density of tdTomato expression are estimated and described as high density (red), medium density (orange), low density (yellow) and negligible density (green). K: Deduced progenitor domain organization of middle-to-caudal regions of the E11.5 pallium. See Figure S2 for additional E11.5 and E17.5 sections. Abbreviations: see legend to Figure 2, and: Cl: claustrum; EPir: endopirifom; OT; olfactory tubercle; Neo; Neocortex; P Amgy; Pallial Amgydala.
Figure 5
Figure 5
Four enhancers with activity in medial pallial (MP) progenitors that fate map to hippocampal subdivisions. Coronal sections show GFP expression at E11.5, and fate mapping with tdTomato expression at P30. Two enhancers show activity and fate map to the rostrodorsal hippocampus (348 and 643); P30 fate map pictures are shown at 2x (Panel A’, B’, and C’), 4x (Panel A”, B”, and C”) and 10x (Panel A”’, B”’ and C”’) magnifications. Enhancer 192 fate-maps to the fimbria and choroid plexus. One enhancer (653) shows activity and fate maps to the caudoventral hippocampus and choroid plexus; results are compared with the rostrodorsal hippocampal enhancer (348); P30 fate map pictures are shown at 2x (Panels D’ and E’), and 4x (Panels D” and E”) magnifications. See Figure 6 for fate mapping annotation, and Figures S2 for additional E11.5 and E17.5 sections. Abbreviations: see legend to Figure 2, and: CA1, CA3: hippocampal pyramidal cell fields; DG: dentate gyrus (Do: dorsal; Ve: ventral); HC: hippocampus; Hy; hypothalamus.
Figure 6
Figure 6
Expansion of the hippocampal primordium at E12.5. Comparison of the activity of MP enhancers 192 and 643 at E11.5 and E12.5. Enhancer activity (GFP expression) is compared with Lmx1a RNA expression using double immunohistochemistry (GFP)/in situ hybridization (Lmx1a). Lmx1a marks the F/Ch domain; at E11.5 both 192 and 643 have nearly identical patterns, sharing a common boundary (arrowhead). However, by E12.5 enhancer 643 activity expands beyond the Lmx1a/enhancer 192 boundary (arrowhead), into the neuroepithelium that generates the dentate gyrus and CA fields (arrow; see Figure 5C’-C”’); note that 192 activity is present in a few scattered hippocampal progenitors (Panel C, arrows). Panel E: Schema summarizing results in panels A-D, showing the expansion of the hippocampus (HC) between E11.5 and E12.5. Panel F: Annotation of fate mapping results from selected enhancers (y axis) in 13 regions of the medial pallium (x axis). Different levels of density of tdTomato expression are estimated and described as high density (red), medium density (orange), low density (yellow) and negligible density (green). Panel G: Deduced progenitor domain organization of E11.5 medial pallium and other regions of the caudal pallium. Abbreviations: see legend to Figure 2.
Figure 7
Figure 7
Transcription regulation of pallial enhancers. A: % of enhancers with ChIP-Seq peaks for PAX6, COUPTFI and PBX1 on LVP+DP+MP, LVP; LVP+ DP DP+MP and MP enhancers. B: Transcription assays in transfected P19 cells (2 days) measuring luciferase expression driven by PAX6 activation of enhancers 636, 840, 643 and 1172. C. PAX6 ChIP-seq analysis from E12.5 cortex showing a peak directly over endogenous enhancer 840 (black bar). D. GFP pallial expression driven by enhancer 840 in E11.5 cortex. D’: Reduced pallial GFP expression in Pax6−/−. E. PAX6 ChIP-seq analysis from E12.5 cortex showing a peak directly over endogenous enhancer 636 (black bar). F. GFP pallial expression driven by enhancer 636 in E11.5 cortex. F’: Reduced pallial GFP expression in Pax6−/−. (Asterisk labels migrating VP neurons) See also Figure S5. Abbreviations: see legend to Figure 2, and: CDP and CMP: caudal DP and MP; SPSe: subpallial septum.

Similar articles

Cited by

References

    1. Ahituv N, Zhu Y, Visel A, Holt A, Afzal V, Pennacchio LA, Rubin EM. Deletion of ultraconserved elements yields viable mice. PLoS Biol. 2007;5:e234. - PMC - PubMed
    1. Armentano M, Chou SJ, Tomassy GS, Leingärtner A, O’Leary DD, Studer M. COUP-TF1 regulates the balance of cortical patterning between frontal/motor and sensory areas. Nat. Neurosci. 2007;10:1277–1286. - PubMed
    1. Bielle F, Griveau A, Narboux-Nême N, Vigneau S, Sigrist M, Arber S, Wassef M, Pierani A. Multiple origins of Cajal-Retzius cells at the borders of the developing pallium. Nat. Neurosci. 2005;8:1002–1012. - PubMed
    1. Bishop KM, Goudreau G, O’Leary DD. Regulation of area identity in the mammalian neocortex by Emx2 and Pax6. Science. 2000;288:344–349. - PubMed
    1. Borello U, Madhavan M, Vilinsky I, Faedo A, Pierani A, Rubenstein J, Campbell K. Sp8 and COUP-TF1 Reciprocally Regulate Patterning and Fgf Signaling in Cortical Progenitors. Cereb. Cortex. 2013 - PMC - PubMed

Publication types

MeSH terms