. 2014 Jun;10(6):470-6.
doi: 10.1038/nchembio.1525. Epub 2014 May 11.

Microbial glycan microarrays define key features of host-microbial interactions

Affiliations

Microbial glycan microarrays define key features of host-microbial interactions

Sean R Stowell et al. Nat Chem Biol. 2014 Jun.

Abstract

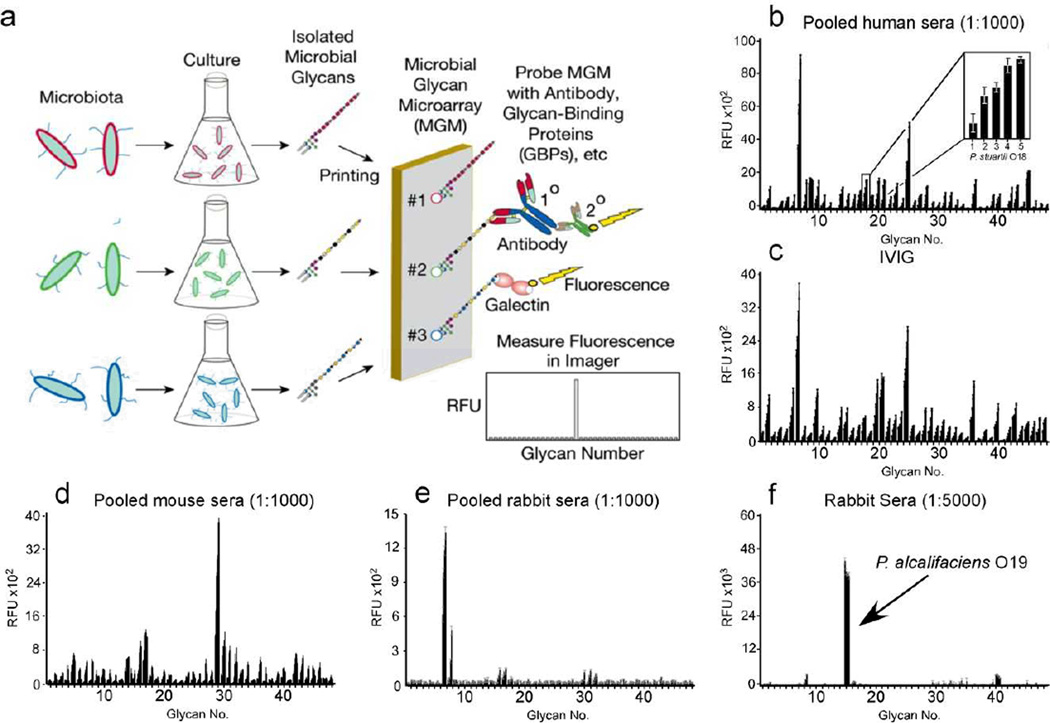
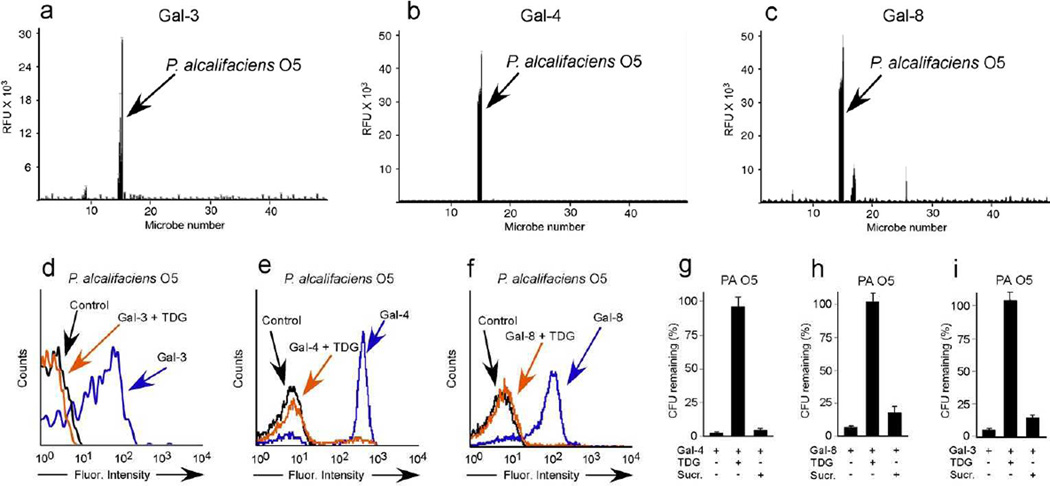
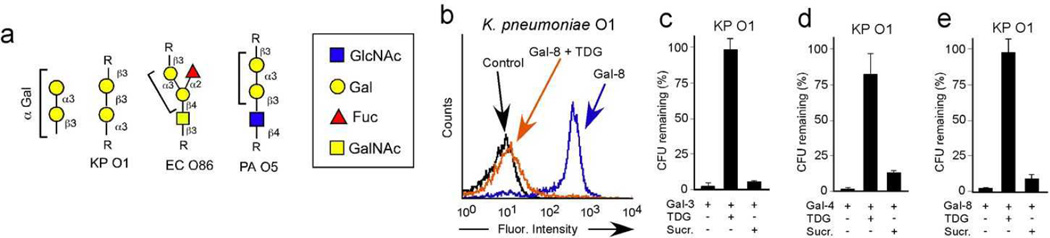
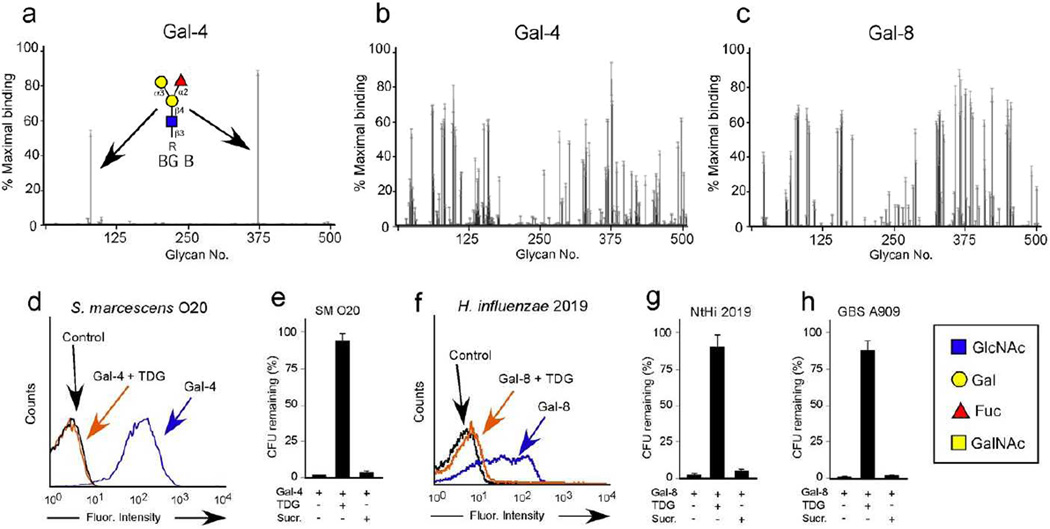
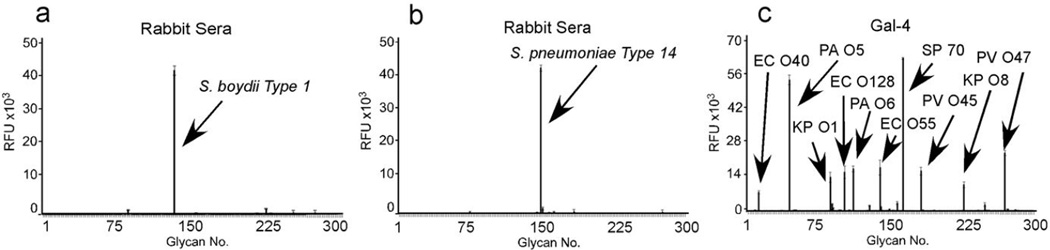
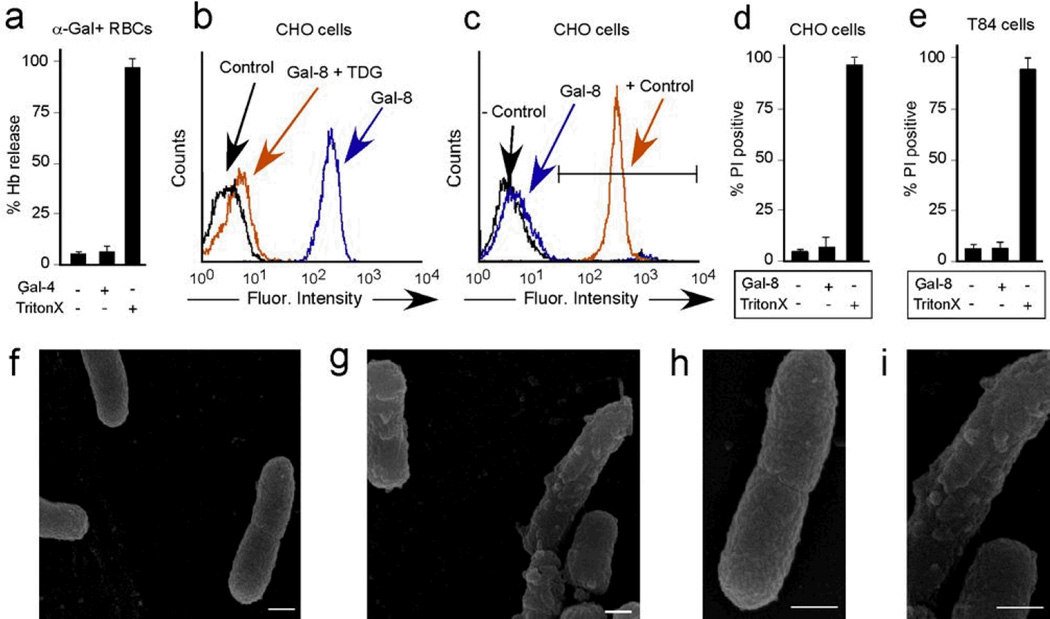
Genomic approaches continue to provide unprecedented insight into the microbiome, yet host immune interactions with diverse microbiota can be difficult to study. We therefore generated a microbial microarray containing defined antigens isolated from a broad range of microbial flora to examine adaptive and innate immunity. Serological studies with this microarray show that immunoglobulins from multiple mammalian species have unique patterns of reactivity, whereas exposure of animals to distinct microbes induces specific serological recognition. Although adaptive immunity exhibited plasticity toward microbial antigens, immunological tolerance limits reactivity toward self. We discovered that several innate immune galectins show specific recognition of microbes that express self-like antigens, leading to direct killing of a broad range of Gram-negative and Gram-positive microbes. Thus, host protection against microbes seems to represent a balance between adaptive and innate immunity to defend against evolving antigenic determinants while protecting against molecular mimicry.


Figures

Figure 1
Figure 1. Production and validation of MGM and recognition of microbial glycan structures by sera
(a) Schematic of MGM design and utility. (b) MGM data obtained after incubation with pooled normal human sera at 1:1000 followed by labeled anti-IgG and anti-IgM). b inset: magnification of antibody interactions with increasing printed concentration of Providencia stuartii O18 BPS (31.25, 62.5, 125, 250, 500 µg/mL). (c) MGM probed with 200 µg/ml IVIG pooled from ~10,000 human donors followed by detection with anti-IgG. (d,e) Detection of pooled normal mouse sera at 1:1000 (d) or pooled normal rabbit sera at 1:1000 (e) with anti-mouse or anti-rabbit IgG, respectively. (f) MGM data obtained after incubation with 1:5000 dilution of sera from rabbits challenged with the indicated bacterial species followed by detection with anti-rabbit IgG. See Supplementary Dataset 1 for complete microarray data.
Figure 2
Figure 2. MGM identifies new bacterial targets for galectin binding and killing
MGM data obtained after incubation with fluorescently tagged Gal-3 (a), Gal-4 (b), and Gal-8 (c) at ~1.5µM. See Supplemetnary Dataset 1 for complete microarray data. Flow cytometric analysis of P. alcalifaciens O5 (PA O5) after incubation with Gal-3 (d), Gal-4 (e), or Gal-8 (f) at ~0.1µM with or without inclusion of 20mM TDG. Quantification of PA O5 after addition of 5µM Gal-4 (g), Gal-8 (h) or Gal-3 (i) with or without addition of 50mM TDG or sucrose (Sucr). n=2–3 in 1 representative experiment of 3; error bars represent means ± 1 s.d.
Figure 3
Figure 3. Bacterial structural database provides new bacterial targets for galectin binding and killing
(a) Schematic representation of glycan structures on the glycan array paired with similar structures found on indicated bacterial strains. (b) Flow cytometric analysis of K. pneumoniae O1 (KP O1) after incubation with ~0.1µM Gal-8 with or without inclusion of 20mM TDG. Quantification of KP O1 after addition of 5µM Gal-3 (c), Gal-4 (d) or Gal-8 (e) with or without addition of 50mM TDG or sucrose (Sucr). n=2–3 in 1 representative experiment of 3; error bars represent means ± 1 s.d.
Figure 4
Figure 4. Galectins bind and kill a broad range of new bacterial targets
(a–c) CFGv4.2 glycan microarray assayed with 0.2µM Gal-4 (a), 5µM Gal-4 (b), and 5µM Gal-8 (c). Error bars represent means ± 1 s.d. See Supplementary Dataset 2 for complete microarray data. (d) Flow cytometric analysis of S. marcescens O20 (SM O20) after incubation with ~0.1µM Gal-4 with or without inclusion of 20mM TDG. (e) Quantification of SM O20 after addition of 5µM Gal-4 with or without addition of 50mM TDG or sucrose (Sucr). (n=2–3 in 1 representative experiment of 3). (e) Flow cytometric analysis of H. influenzae 2019 (NtHi 2019) after incubation with ~0.1µM Gal-8 with or without inclusion of 20mM TDG. (f) Quantification of NtHi 2019 after addition of 5µM Gal-8 with or without addition of 50mM TDG or Sucr. (n=2 in 1 representative experiment of 3). (g) Quantification of Streptococcus agalactiae A909 (GBS A909) after addition of 5µM Gal-8 with or without addition of 50mM TDG or Sucr.
Figure 5
Figure 5. Expansion of MGM to include gram positive and additional gram negative microbial antigens
(a–d) Expanded MGM data obtained after incubation with a 1:5000 dilution of sera from rabbits challenged with Providencia alcalifaciens O19 (a) or Streptococcus pneumoniae Type 14 (b) or 10µM Gal-4 (c). EC O128 = Escherichia coli O128. EC O40 = Escherichia coli O40. PV O45 = Proteus vulgaris O45. PA O5 = Providencia alcalifaciens O5. PA O6 = Providencia alcalifaciens O6. KP O1 = Klebsiella pneumonia O1. EC O55 = Escherichia coli O55. SP 70 = Streptococcus pneumoniae type 70. PV O47 = Proteus vulgaris O47. See Supplementary Dataset 3 for complete microarray data.
Figure 6
Figure 6. Galectin binding to eukaryotic cells does not alter cell viability
(a) Quantification of hemoglobin release from rabbit erythrocytes after incubation with 5µM Gal-4 or 1% Triton X (n=2–3 in 1 representative experiment of 3). (b) Flow cytometric analysis of WT CHO cells after incubation with ~0.1µM Gal-8 with or without inclusion of 20mM TDG. (c) Flow cytometric analysis of PI positive WT CHO cells after incubation with ~0.1µM Gal-8 or 1% Triton X (+ control). (d) Quantification of percent PI+ WT CHO cells after incubation with 5µM Gal-8 or 0.1% Triton X (n=2 in 1 representative experiment of 3). (e) Quantification of percent PI+ T84 epithelial cells after incubation with 5 µM Gal-8 or 0.1% Triton X (n=3 in 1 representative experiment of 3). (f–i) Scanning electron microscopy images (15,000×) of KP O1 after incubation with PBS (f) or 5µM Gal-8 (g). Increased magnification of panels f (h) and g (i). Scale bars = 500 nm.

Comment in

References

    1. Strugnell RA, Wijburg OL. The role of secretory antibodies in infection immunity. Nat Rev Microbiol. 2010;8:656–667. - PubMed
    1. Shanahan F. The colonic microflora and probiotic therapy in health and disease. Curr Opin Gastroenterol. 2011;27:61–65. - PubMed
    1. Gevers D, et al. The human microbiome project: a community resource for the healthy human microbiome. PLoS Biol. 2012;10:e1001377. - PMC - PubMed
    1. Yatsunenko T, et al. Human gut microbiome viewed across age and geography. Nature. 2012;486:222–227. - PMC - PubMed
    1. Arumugam M, et al. Enterotypes of the human gut microbiome. Nature. 2011;473:174–180. - PMC - PubMed

Publication types

MeSH terms

LinkOut - more resources