. 2014 Jul;184(7):2066-81.
doi: 10.1016/j.ajpath.2014.03.014. Epub 2014 May 9.

Endoplasmic reticulum stress mediates amyloid β neurotoxicity via mitochondrial cholesterol trafficking

Affiliations

Endoplasmic reticulum stress mediates amyloid β neurotoxicity via mitochondrial cholesterol trafficking

Elisabet Barbero-Camps et al. Am J Pathol. 2014 Jul.

Abstract

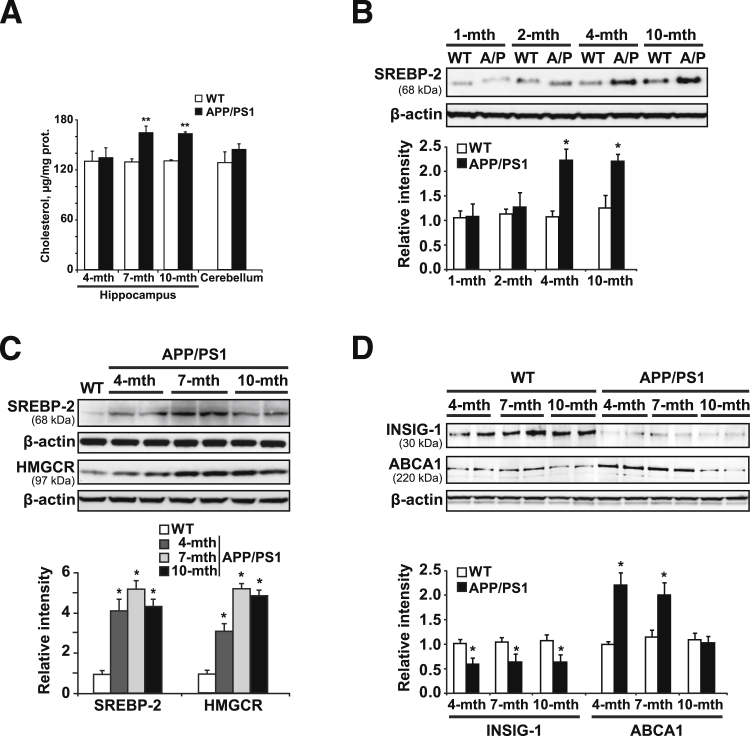
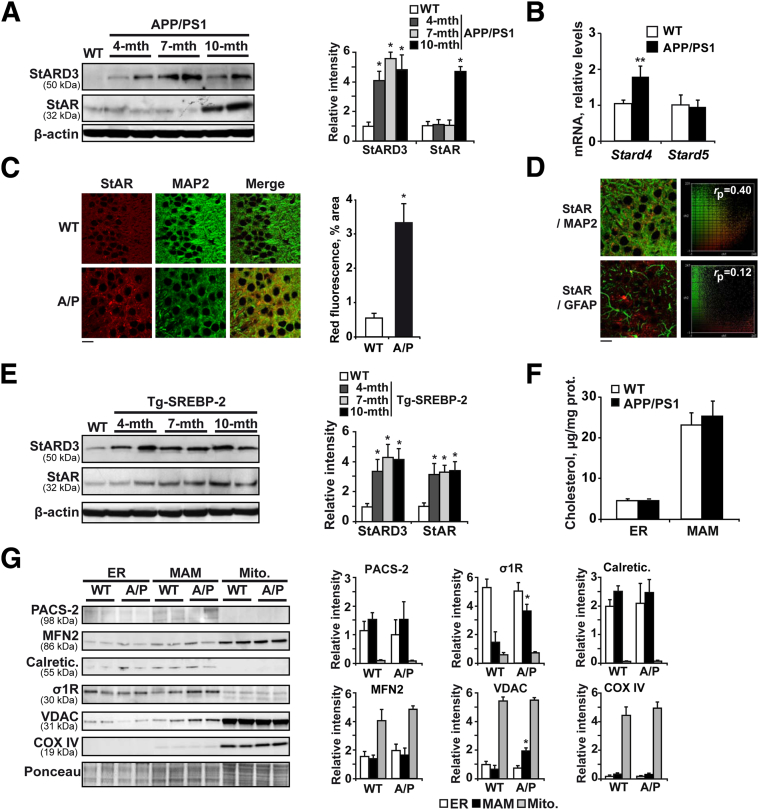
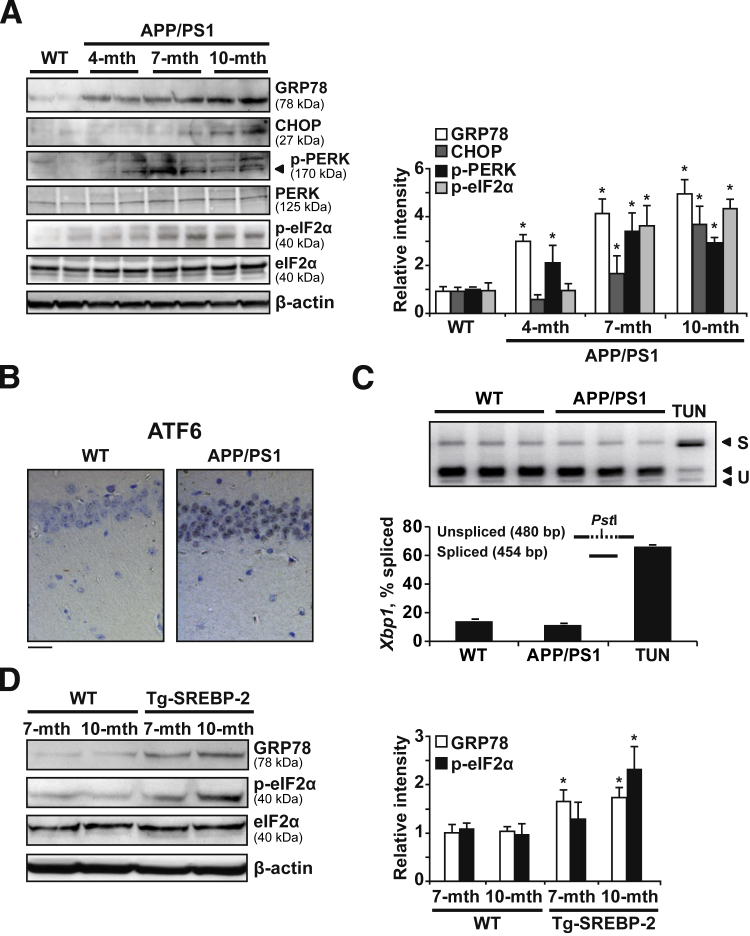
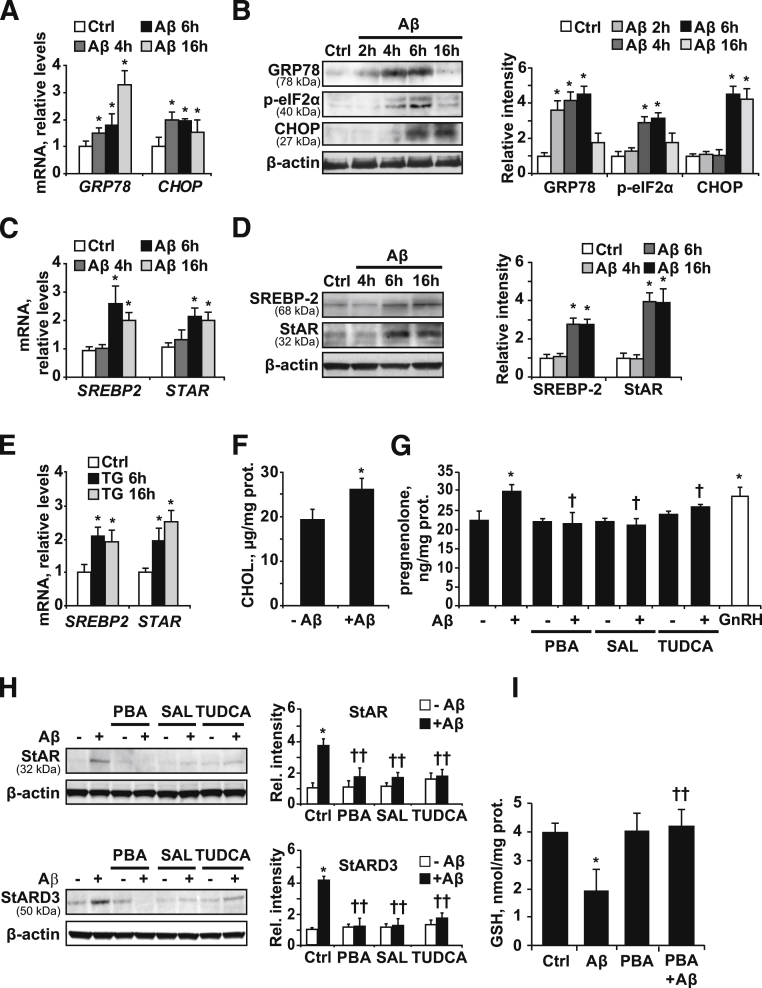
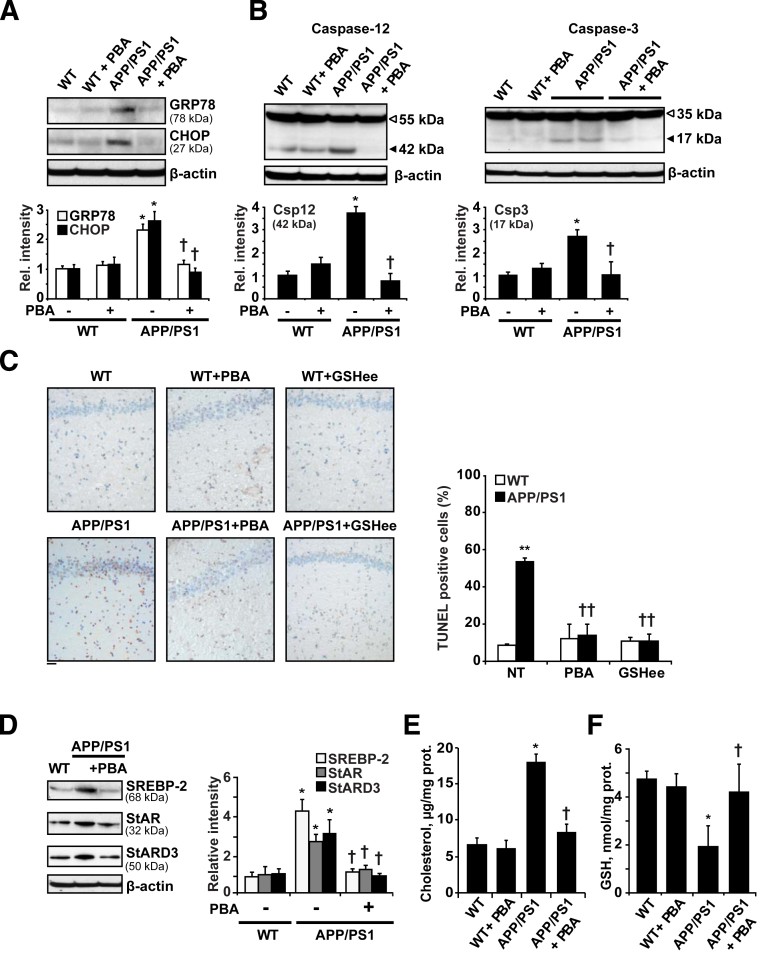
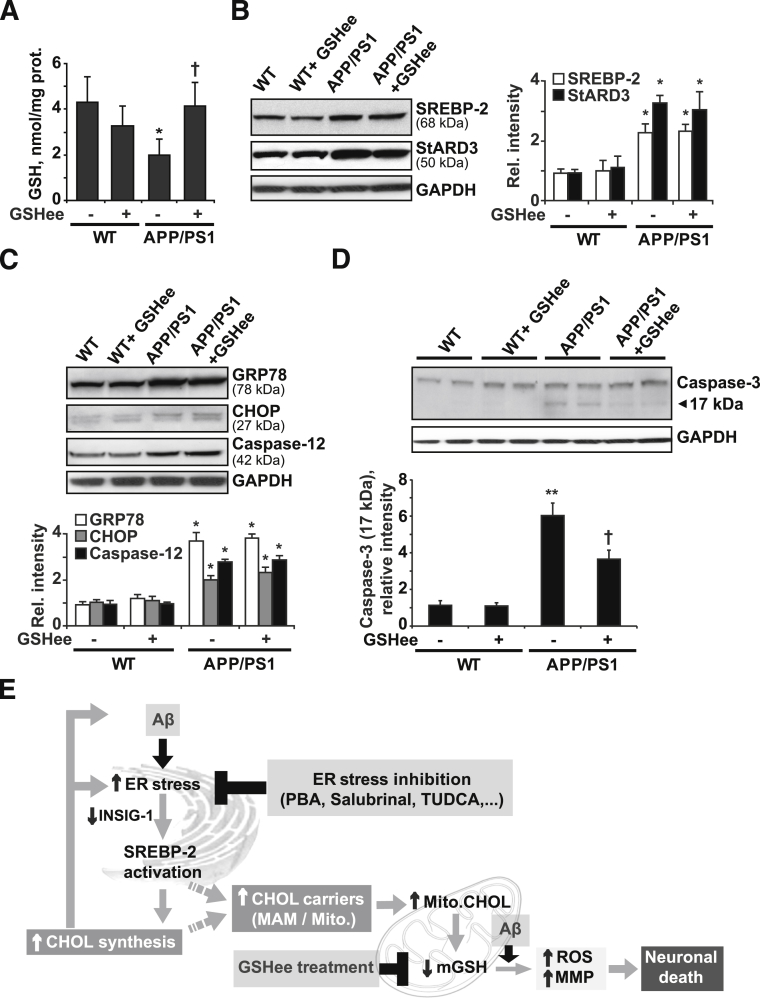
Disrupted cholesterol homeostasis has been reported in Alzheimer disease and is thought to contribute to disease progression by promoting amyloid β (Aβ) accumulation. In particular, mitochondrial cholesterol enrichment has been shown to sensitize to Aβ-induced neurotoxicity. However, the molecular mechanisms responsible for the increased cholesterol levels and its trafficking to mitochondria in Alzheimer disease remain poorly understood. Here, we show that endoplasmic reticulum (ER) stress triggered by Aβ promotes cholesterol synthesis and mitochondrial cholesterol influx, resulting in mitochondrial glutathione (mGSH) depletion in older age amyloid precursor protein/presenilin-1 (APP/PS1) mice. Mitochondrial cholesterol accumulation was associated with increased expression of mitochondrial-associated ER membrane proteins, which favor cholesterol translocation from ER to mitochondria along with specific cholesterol carriers, particularly the steroidogenic acute regulatory protein. In vivo treatment with the ER stress inhibitor 4-phenylbutyric acid prevented mitochondrial cholesterol loading and mGSH depletion, thereby protecting APP/PS1 mice against Aβ-induced neurotoxicity. Similar protection was observed with GSH ethyl ester administration, which replenishes mGSH without affecting the unfolded protein response, thus positioning mGSH depletion downstream of ER stress. Overall, these results indicate that Aβ-mediated ER stress and increased mitochondrial cholesterol trafficking contribute to the pathologic progression observed in old APP/PS1 mice, and that ER stress inhibitors may be explored as therapeutic agents for Alzheimer disease.


Figures

Figure 1
Figure 1
Expression levels of cholesterol biosynthesis-related proteins. A: Cholesterol levels. B: Western blot analysis of SREBP-2 protein levels in brain extracts from WT mice and APP/PS1 (A/P) mice at the indicated ages. C: Western blot analysis of SREBP-2 and HMG-CoA reductase (HMGCR) proteins in brain extracts from 10-month-old WT mice and APP/PS1 mice at different ages. D: Representative immunoblots of INSIG-1 and ABCA1 presence in brain extracts from WT mice and APP/PS1 mice at the indicated ages. Relative intensity values are densitometric values of the bands representing the specific protein immunoreactivity normalized with the values of the corresponding β-actin bands. P < 0.05, ∗∗P < 0.01 versus WT mice values by unpaired, two-tailed Student's t-test (A, B, and D) and one-way analysis of variance with the Dunnett post hoc test (C) (n = 4 to 6). mth, month.
Figure 2
Figure 2
Expression levels of cholesterol-transporting polypeptides. A: Representative immunoblots of StARD3 and StAR showing an increased presence of these cholesterol carriers in brain samples from APP/PS1 mice compared with 10-month-old WT mice. B: mRNA levels of StARD4 and StARD5 in brain samples from WT and APP/PS1 mice at 10 months of age analyzed by quantitative RT-PCR. Absolute mRNA values were determined, normalized to 18S rRNA, and reported as relative levels compared to the expression in WT mice. C: Representative confocal images of StAR (red) and MAP2 (green) immunofluorescence labeling of hippocampal sections from 10-month-old WT mice and APP/PS1 mice. D: Representative confocal images of hippocampal sections from 10-month-old APP/PS1 mice immunostained with anti-StAR (red) and anti-MAP2 or anti–glial fibrillary acidic protein (GFAP; green). The extent of colocalization was quantified using the linear Pearson correlation coefficient (rp); the resulting scatterplot images are shown on the right. A value of 1.0 indicates complete colocalization of two fluorescent signals. Note that StAR preferentially colocalizes with neurons labeled with anti-MAP2 compared with astrocytes labeled with anti-GFAP. E: Western blot analysis of StARD3 and StAR expression in brain from 10-month-old WT mice and Tg–SREBP-2 mice at the indicated ages. F: Total cholesterol in ER and MAMs from brain extracts of 10-month-old WT and APP/PS1 mice. G: Representative immunoblots showing the expression of calreticulin (calregulin), the sigma-1 receptor (σ1R), phosphofurin acidic cluster sorting protein 2 (PACS-2), and the mitochondrial proteins cyclooxygenase 4 (COX IV), voltage-dependent anion-selective channel protein (VDAC), and mitofusin 2 (MFN2) in ER, MAMs, and mitochondria from 10-month-old WT and APP/PS1 (A/P) mice. In all Western blot analyses the densitometric values of the bands representing the specific protein immunoreactivity were normalized with the values of the corresponding β-actin bands or Ponceau Staining. P < 0.05, ∗∗P < 0.01 versus WT mice values by one-way analysis of variance with the Dunnett post hoc test (A and E) and the unpaired, two-tailed Student's t-test (B, C, and G) (n = 3 to 6). Scale bars: 15 μm (C and D). mito., mitochondria; mth, month.
Figure 3
Figure 3
APP/PS1 mice display early ER stress. A: Representative immunoblots showing the expression of the chaperonic protein GRP78 and the ER stress signaling pathway proteins PERK, phospho-PERK, eIF2α, phospho-eIF2α, and CHOP in brain extracts from 10-month-old WT mice and APP/PS1 mice at the indicated ages. B: Immunohistochemical staining of ATF6. Representative photomicrographs of CA1 hippocampus showing nuclear localization of ATF6 in 7-month-old APP/PS1 mice (n = 3). C: Analysis of Xbp1 mRNA splicing. Total RNAs from brain of 7-month-old WT and APP/PS1 mice were subjected to RT-PCR as described in Materials and Methods. After digestion with PstI, the PCR products were resolved in a 2% agarose gel electrophoresis. The PCR products of Xbp1 mRNA spliced (S) remained intact (454 bp), whereas the unspliced products (U) were cut into two fragments of 289 and 191 bp, as indicated by the arrows. mRNA from liver of WT mice treated i.p. with 1 mg/kg 24 hours tunicamycin (TUN) was used as a positive control (n = 3). D: Western blot analysis of GRP78, eIF2α, and phospho-eIF2α in brain extracts from WT mice and SREBP-2 transgenic mice. In all Western blot analyses, densitometric values of the bands representing the specific protein immunoreactivity were normalized with the values of the corresponding β-actin bands. P < 0.05 versus WT mice values by one-way analysis of variance with the Dunnett post hoc test (A), and the unpaired two-tailed Student's t-test (D) (n = 6). Scale bar = 50 μmol/L (B). mth, month.
Figure 4
Figure 4
ER stress induced by oligomeric Aβ1-42 promotes mitochondrial cholesterol transport and mGSH depletion in SH-SY5Y cells. GRP78, p-eIF2α, and CHOP expression levels in cells treated with 10 μmol/L Aβ at the indicated time points, analyzed by quantitative RT-PCR (A) and Western blot (B). SREBP-2 and StAR expression levels after exposure to 10 μmol/L Aβ at the indicated time points, analyzed by quantitative RT-PCR (C) and Western blot (D). E: mRNA levels of SREBP-2 and StAR after incubation with 2 μmol/L thapsighargin (TG) at the indicated time points, analyzed by quantitative RT-PCR. mRNA values were normalized to 18S rRNA and reported as relative levels compared to the expression in WT mice. F: Mitochondrial cholesterol levels after incubation with 10 μmol/L Aβ for 48 hours, and 0.75 mmol/L inhibitor aminoglutethimide was added for the last 24 hours. G: Quantification of pregnenolone delivered to media as indicator of mitochondrial cholesterol loading. Cells were exposed to 10 μmol/L Aβ with or without 5 mmol/L PBA, 50 μmol/L salubrinal (SAL), or 100 μmol/L tauroursodeoxycholic acid (TUDCA) pretreatment for 1 hour. After 48 hours of incubation new media containing 20 μmol/L of trilostane was replaced and cells were left to accumulate the steroid hormone for 48 hours. Pregnenolone levels in media were determined as described in Materials and Methods. As a positive control, cells were treated with 1 nmol/L gonadotropin-releasing hormone (GnRH) for 48 hours. Western blot analysis of the mitochondrial cholesterol carriers StAR and StARD3 in cellular extracts (H) and mitochondrial GSH levels after 4 days of 10 μmol/L Aβ incubation with or without 5 mmol/L PBA, 50 μmol/L SAL, or 100 μmol/L TUDCA pretreatment for 1 hour (I). In all of the Western blot analyses densitometric values of the bands representing the specific protein immunoreactivity were normalized with the values of the corresponding β-actin bands. P < 0.05 versus control values; P < 0.05, ††P < 0.01 versus Aβ treatment values by one-way analysis of variance with the Dunnett post hoc test (A–E), the unpaired, two-tailed Student's t-test (F), and one-way analysis of variance with the Bonferroni multiple comparisons test (G-I) (n = 3 to 6).
Figure 5
Figure 5
Treatment with the chemical chaperone PBA restores cholesterol homeostasis and provides protection against ER stress–induced cell death in APP/PS1 mice. Fifteen-month-old mice were treated i.p. with 500 mg/kg/d PBA for 2 weeks (n = 6 mice per group) and levels of ER stress markers, caspase activation, and cholesterol-related proteins were analyzed by Western blot. A: Representative immunoblots of GRP78 and CHOP presence in brain extracts. B: Representative immunoblots of caspase-12 and caspase-3 cleavage; arrows show fragmented caspase-12 (Csp12) (∼42 kDa) and cleaved caspase-3 active fragment (Csp3) (17 kDa). C: Representative images of apoptotic cells in hippocampus from 15-month-old WT and APP/PS1 mice with or without PBA or GSHee (i.p. 1.25 mmol/kg/d for 2 weeks) assessed by terminal deoxynucleotidyl transferase-mediated dUTP nick-end labeling (TUNEL). D: Representative immunoblots showing a significant reduction of SREBP-2, StARD3, and StAR in brain samples from APP/PS1 mice after PBA treatment. Mitochondrial cholesterol content (E) and mGSH levels (F). In all Western blot analyses densitometric values of the bands representing the specific protein immunoreactivity were normalized with the values of the corresponding β-actin bands. P < 0.05, ∗∗P < 0.01 versus WT values; P < 0.05, ††P < 0.01 versus APP/PS1 mice without treatment by one-way analysis of variance with the Bonferroni multiple comparisons test (n = 3 to 6). Scale bar = 50 μmol/L (C).
Figure 6
Figure 6
In vivo GSH ethyl ester treatment. WT and APP/PS1 mice were treated i.p. with 1.25 mmol/kg/d GSHee for 2 weeks (n = 6 mice per group). A: mGSH levels. B: Representative immunoblots showing the expression levels of SREBP-2 protein and the mitochondrial cholesterol carrier StARD3 in brain extracts after GSHee treatment. C: Western blots analysis of ER stress markers GRP78 and CHOP levels and the presence of cleaved caspase-12 active fragment (42 kDa) in brain extracts after GSHee treatment. D: Representative immunoblots of caspase-3 cleavage; arrow shows cleaved active fragment (17 kDa). Glyceraldehyde-3-phosphate dehydrogenase (GAPDH) levels were analyzed as a loading control. In all Western blot analyses densitometric, values of the bands representing the specific protein immunoreactivity were normalized with the values of the corresponding GAPDH bands. E: Scheme illustrating the proposed model by which Aβ-induced ER stress would contribute to neuronal death through promoting cholesterol synthesis and translocation to mitochondria. This cascade of events leading to neuronal death could be counteracted by inhibiting ER stress or by restoring the mGSH levels with GSHee therapy. P < 0.05, ∗∗P < 0.01 versus WT mice values; P < 0.05 versus APP/PS1 mice values by one-way analysis of variance with the Bonferroni multiple comparisons test; n = (3 to 6). CHOL, cholesterol; Mito., mitochondrial; MMP, mitochondrial membrane permeabilization.

References

    1. Sparks D.L., Scheff S.W., Hunsaker J.C., 3rd, Liu H., Landers T., Gross D.R. Induction of Alzheimer-like beta-amyloid immunoreactivity in the brains of rabbits with dietary cholesterol. Exp Neurol. 1994;126:88–94. - PubMed
    1. Cutler R.G., Kelly J., Storie K., Pedersen W.A., Tammara A., Hatanpaa K., Troncoso J.C., Mattson M.P. Involvement of oxidative stress-induced abnormalities in ceramide and cholesterol metabolism in brain aging and Alzheimer's disease. Proc Natl Acad Sci U S A. 2004;101:2070–2075. - PMC - PubMed
    1. Bandaru V.V., Troncoso J., Wheeler D., Pletnikova O., Wang J., Conant K., Haughey N.J. ApoE4 disrupts sterol and sphingolipid metabolism in Alzheimer's but not normal brain. Neurobiol Aging. 2009;30:591–599. - PMC - PubMed
    1. Xiong H., Callaghan D., Jones A., Walker D.G., Lue L.F., Beach T.G., Sue L.I., Woulfe J., Xu H., Stanimirovic D.B., Zhang W. Cholesterol retention in Alzheimer's brain is responsible for high beta- and gamma-secretase activities and Abeta production. Neurobiol Dis. 2008;29:422–437. - PMC - PubMed
    1. Panchal M., Loeper J., Cossec J.C., Perruchini C., Lazar A., Pompon D., Duyckaerts C. Enrichment of cholesterol in microdissected Alzheimer's disease senile plaques as assessed by mass spectrometry. J Lipid Res. 2010;51:598–605. - PMC - PubMed

Publication types