Review
. 2014 Jun:20:46-53.
doi: 10.1016/j.cbpa.2014.04.008. Epub 2014 May 9.

Faster fluorescence microscopy: advances in high speed biological imaging

Affiliations
Review

Faster fluorescence microscopy: advances in high speed biological imaging

Peter W Winter et al. Curr Opin Chem Biol. 2014 Jun.

Abstract

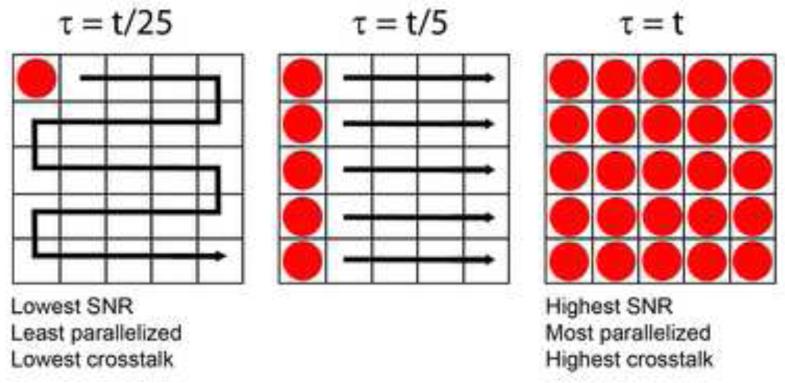
The past decade has seen explosive growth in new high speed imaging methods. These can broadly be classified as either point-scanning (which offer better depth penetration) or parallelized systems (which offer higher speed). We discuss each class generally, and cover specific advances in diffraction-limited microscopes (laser-scanning confocal, spinning-disk, and light-sheet) and superresolution microscopes (single-molecule imaging, stimulated emission-depletion, and structured illumination). A theme of our review is that there is no free lunch: each technique has strengths and weaknesses, and an advance in speed usually comes at the expense of either spatial resolution or depth penetration.


Figures

Fig. 1
Fig. 1. Effects of parallelizing excitation
Left: a single excitation spot (red) is scanned through a 5 × 5 = 25 pixel grid, illuminating one pixel at a time. This serial illumination is reminiscent of point-scanning confocal microscopy, and implies that for total frame exposure time t (the time required to illuminate all pixels), the per-pixel dwell time is only τ = t/25. Note that in this case, there is no crosstalk as pixels are illuminated sequentially. Middle: excitation has been partially parallelized, so that an entire column of pixels is excited at once (similar to line-scanning confocal microscopy). The per-pixel dwell time is now τ = t/5 for total exposure time t, increasing the signal-to-noise ratio (SNR) relative to the point-scanning case at left. Since multiple pixels are illuminated simultaneously, emission originating from spatially distinct regions in the sample (especially from outside the focal plane) may leak over to neighboring pixels, resulting in crosstalk and degrading optical sectioning relative to the point-scanning case. Another example of partially parallelized excitation is the spinning disk confocal microscope. Right: all pixels are simultaneously illuminated (similar to widefield microscopy), so for frame exposure time t, each pixel is also exposed for time τ = t. SNR is maximized, but so is pixel crosstalk, and optical sectioning is worse than either the point- or line-scanning case.
Fig. 2
Fig. 2. High speed imaging at the diffraction-limit
(a) Functional imaging of cortical neurons was performed in tissue slabs with a temporal resolution of 1kHz, along a cyclic trajectory. The image shows a 3D rendering of neurons of interest in the scan volume (100×100×100μm) loaded with OGB1-AM. (b) Segmentation of (a) representing neurons as spheres. (c) Fluorescence measurements from selected neurons in response to stimulation with an extracellular electrical burst. (d) 1PE and (e) 2PE excitation images of a live drosophila embryo expressing EB1-GFP. Images were collected approximately 25 μm into the sample and consisted of horizontal sections of the hindgut as observed from the dorsal side. EB1 comets, indicated by yellow arrows (f) are observed in 2PE, but not 1PE. (g) Tracked EB1 comet paths are shown with colored lines. (h) Bleaching comparison between SDCM and diSPIM, on cells expressing EB3-GFP. At similar initial SNR, cells imaged with SDCM were sampled 3× less frequently than diSPIM and with 3.2× fewer planes per volume, but exhibited greatly increased bleaching rates. (i) Higher magnification views of the rectangular subregions indicated in (h), emphasizing the superior axial resolution obtained in diSPIM compared to SDCM. (j) Bleaching rates were calculated from a 20×20 μm area inside each cell; SNR was calculated as the ratio of the measured area inside the cell to an area outside the cell. Data were fitted to single exponentials; bleaching half times are indicated on the graph. (k) Whole brain imaging of neuronal activity in live Zebrafish embryos reported by GCaMP5G, a genetically encoded calcium indicator, in elavl3:GCaMP5G fish. Changes in GCaMP5G fluorescence are superimposed over the reference anatomy. Panels represent whole-brain volumes recorded at time intervals of 1.39 s. Nearly simultaneous activation of numerous neurons occurs at t0 spanning both the midbrain and hindbrain. Scalebars: (d,e): 20 μm; (f): 5 μm; (g): 10 μm; (k): 100 μm. Panels (a-c) are adapted from Botcherby et al. [3] with permission from PNAS. Panels (d-g) are adapted from Shimozawa et al. [6] with permission from PNAS. Panels (h-j) are adapted from Wu et al. [9] with permission from Nature. Panel (k) is adapted from Ahrens et al. [13] with permission from Nature.
Fig. 3
Fig. 3. Fast super-resolution imaging
Comparative 3B (a) and widefield (b) images of immunolabeled, fixed podosomes. Images were acquired in 6 s. (c-e) Higher magnification views of white, blue, and green rectangles in (a) to emphasize resolution. (f) Widefield and (g) parallelized RESOLFT images of rsEGFP-labeled keratin in a live cell, acquired in 0.4 s. Insets represent higher magnification views of rectangle in (g). The marked fiber has an apparent diameter of 95 nm in the RESOLFT image. (h-j) Instant SIM images of GFP-labeled endoplasmic reticulum in a live cell. (h): overview; (i, j): higher magnification views of white rectangle and square in (h), emphasizing fast temporal dynamics. Arrows in (j) highlight growth and remodeling of individual ER tubules. Images were acquired at 100 Hz. Scalebars: (a,b): 2 μm; (c-e): 500 nm; (f): 10 μm; (g): 5 μm; (h): 200 nm; (i, j): 10 μm (insets: 1 μm). Panels (a-e) are adapted from Cox et al. [22] with permission from Nature. Panels (f-g) are adapted from Chmyrov et al. [34] with permission from Nature. Panels (h-j) are adapted from York et al. [37] with permission from Nature.
Fig. 4
Fig. 4. Alternative strategies for high-speed fluorescence imaging
(a) Top: Radiofrequency multiplexed excitation concept. Each pixel in the horizontal direction is illuminated at a different radiofrequency. Scanning the excitation in the vertical direction ensures that successive rows of pixels are illuminated sequentially, thus resulting in a unique ‘tag’ for each pixel in the image. Emission is collected on a fast point-detector and post-processing algorithms are applied to reconstruct an image. The method attains kHz or faster imaging rates, sufficient to ‘freeze’ flowing cells moving at 1 m/s (bottom). (b) Left: Temporal pixel multiplexing (TPM) concept. An image is divided into subregions (e.g. gray square), and neighboring pixels in each subregion are illuminated sequentially during image acquisition. Combining all pixels from a given illumination period (blocks of 1s, 2s, 3s, and 4s in bottom graphic) results in an image sequence with reduced spatial resolution, but increased temporal resolution (here a high resolution image acquired in one second is converted into a sequence of 4 lower resolution images, each acquired in 0.25 s). Right: An example highlighting a high spatial resolution scene of a milk droplet falling into water, acquired in 40 ms. Motion blur obscures the droplet (red arrowhead). Applying the TPM concept subdivides the image into a series of 16 lower resolution images, each spanning a 2.5 ms interval, which clearly resolve the milk droplet. (c) Left: Placing a suitably engineered diffraction grating (MFG) one Fourier plane away from the primary image plane spatially segregates light corresponding to different focal planes in the sample. In combination with color-correction optics, an instant focal stack is obtained on a widefield detector. Right: A multifocus stack of neurons in a developing C. elegans embryo. Nine planes were simultaneously acquired with an exposure time of 0.11 s. Panel (a) is adapted from Diebold et al. [42] with permission from Nature. Panel (b) is adapted from Bub et al. [43] with permission from Nature. Panel (c) is adapted from Abrahamsson et al. [44] with permission from Nature.

References

    1. Fischer RS, Wu Y, Kanchanawong P, et al. Microscopy in 3D: a biologist’s toolbox. Trends Cell Biol. 2011;21:682–691. - PMC - PubMed
    1. Wu Y, Christensen R, Colon-Ramos D, Shroff H. Advanced optical imaging techniques for neurodevelopment. Current Opinion in Neurobiology. 2013;23:1090–1097. - PMC - PubMed
    1. Botcherby EJ, Smith CW, Kohl MM, et al. Aberration-free three-dimensional multiphoton imaging of neuronal activity at kHz rates. PNAS. 2012;109:2919–2924. - PMC - PubMed
    1. Katona G, Szalay G, Maak P, et al. Fast two-photon in vivo imaging with three-dimensional random-access scanning in large tissue volumes. Nature Methods. 2012;9:201–208. Acousto-optic scanning technology permits high speed 3D imaging hundreds of times faster than galvanometric scanners, enabling 50 distinct points to be interrogated across nearly cm sized volumes every ms.

    1. Cheng A, Goncalves JT, Golshani P, et al. Simultaneous two-photon calcium imaging at different depths with spatiotemporal multiplexing. Nature Methods. 2011;8:139–142. - PMC - PubMed

Publication types