. 2014 Jun;17(6):832-40.
doi: 10.1038/nn.3717. Epub 2014 May 11.

Mitochondrial oxidant stress in locus coeruleus is regulated by activity and nitric oxide synthase

Affiliations

Mitochondrial oxidant stress in locus coeruleus is regulated by activity and nitric oxide synthase

Javier Sanchez-Padilla et al. Nat Neurosci. 2014 Jun.

Abstract

Loss of noradrenergic locus coeruleus (LC) neurons is a prominent feature of aging-related neurodegenerative diseases, such as Parkinson's disease (PD). The basis of this vulnerability is not understood. To explore possible physiological determinants, we studied LC neurons using electrophysiological and optical approaches in ex vivo mouse brain slices. We found that autonomous activity in LC neurons was accompanied by oscillations in dendritic Ca(2+) concentration that were attributable to the opening of L-type Ca(2+) channels. This oscillation elevated mitochondrial oxidant stress and was attenuated by inhibition of nitric oxide synthase. The relationship between activity and stress was malleable, as arousal and carbon dioxide increased the spike rate but differentially affected mitochondrial oxidant stress. Oxidant stress was also increased in an animal model of PD. Thus, our results point to activity-dependent Ca(2+) entry and a resulting mitochondrial oxidant stress as factors contributing to the vulnerability of LC neurons.


Figures

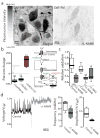
Figure 1
Figure 1. LC neurons were autonomous pacemakers with broad action potential spikes
(a) Biocytin–labeled neuron (red, stained with streptavidin–conjugated to alexa594) colocalised with neurons immunoreactive for the LC biomarker tyrosine hydroxylase (TH). To the right, a representative reconstruction of a biocytin–filled LC neuron is shown. (b) Representative LC recording displaying autonomous spiking activity, recordings performed in the presence of glutamate and GABA receptor synaptic blockers. Bottom panel shows a representative trace of LC recording with spikelet activity following blockade of Nav1 channels with TTX (1 μM). Under our recording conditions, more than 90% of the LC neurons recorded displayed spikelet activity (n=20 neurons, from 10 mice). (c) Representative traces showing spike width in LC neurons (n=5 neurons, from 3 mice, median=2.4 sec) compared to globus pallidus (GP) neurons (n=6 neurons, from 3 mice, median=0.28 sec). Right panel shows box–plot quantification with spike widths in LC neurons significantly wider than GP neurons (p=0.004). Data presented as whisker box plots displaying median and interquartile ranges, and analyzed using Mann-Whitney test
Figure 2
Figure 2. Engagement of L–type channels mediated dendritic Ca2+ oscillations during spiking activity in LC
(a) Left panel shows a schematic of an LC neuron illustrating of our whole–cell current clamp–recording configuration of spiking activity synchronized to 2PLSM dendritic Ca2+ line–scan imaging. Spiking activity is accompanied with phase–locked Ca2+ oscillations in distal dendrites (80–100 μm away from soma), detected in full–spike mode (control) or in the presence of TTX. Antagonism of L–type Ca2+ channels with 1 μM isradipine eliminates Ca2+ oscillations in the presence of TTX (n=4 neurons from 4 mice; p<0.001, Wilcoxon matched–pairs signed rank test). (b) Quantitative PCR analysis demonstrates mRNA expression of both Cav1.2 and Cav1.3 L–type channel subunits in LC neurons (n=6 mice). (c) Representative spiking activity traces in the presence of TTX before and after selective antagonism of Cav1.3 channels with 50 μM BPN4689, and non–selective antagonism of Cav1.2 and Cav1.3 with 1 μM isradipine. Antagonism of Cav1.3 channels with BPN4689 significantly decreased spike amplitude (p=0.017), frequency (p=0.018), and amplitude of dendritic Ca2+ oscillations (p=0.023) in LC neurons (n=5 neurons from 5 mice). Residual spiking activity and Ca2+ oscillations were attenuated completely by 1 μM isradipine suggesting that Cav1.2 channels mediated the residual activity (p<0.001). Data presented as whisker box plots displaying median and interquartile ranges, and analyzed using Mann-Whitney test.
Figure 3
Figure 3. L–type Ca2+ channels were not essential to sustain autonomous spiking but necessary under conditions of elevated spike rate
(a) Representative traces showing that antagonism of L–type channels with isradipine (5 μM) does not affect spike rate in LC neurons (n=4 neurons from 4 mice, p=0.700). (b) Box–plot quantification showing blockade of Nav1 channels slows down spike rate (p=0.032), and leaving smaller amplitude spikelets attenuated by antagonism of L–type Ca2+ channels with isradipine (1 μM) (n=10 neurons from 10 mice, p<0.001). (c) Representative perforated–patch current clamp recordings of LC neurons following high potassium (K+), leading to elevated spike rate. Under control conditions (n=3 neurons from 3 mice), elevated spike rate is sustained for as long as recordings were held. In the presence of 500 nM isradipine, LC neurons failed to continue spiking after 20 minutes of high K+ (n=3 neurons from 3 mice), suggesting that L–type channels are necessary during periods of elevated spike rates. Data presented as whisker box plots displaying median and interquartile ranges, and analyzed using Mann-Whitney test.
Figure 4
Figure 4. Endoplasmic reticulum sequestered cytosolic Ca2+ under conditions of low intrinsic Ca2+ buffering
(a) Representative somatic Ca2+ transients evoked by single spikes sampled at different concentrations of Fluo4. Ca2+ transients displayed decreased transient amplitude and increased decay time with increasing Fluo4. The change in intracellular Ca2+ concentration ([ΔCa2+]) was calculated and then plotted against the calculated added extrinsic buffer (KF) (middle panel), and data points were fitted using a linear regression to compute endogenous buffering capacity (KB), calculated from the negative x–intercept. Box plot quantification revealed a median KB in LC neurons of 58 (n=4 neurons from 4 mice). (b)Representative dendritic Ca2+ traces averaged from pacemaking spike–triggered Ca2+ transients before and after antagonism of ryanodine receptors (RyR) with 10 μM ryanodine. Antagonism of RyRs significantly decreased the amplitude of Ca2+ transients, consistent with Ca2+–induced Ca2+ release (CICR) occurring during autonomous spiking (n=5 neurons from 5 mice, p=0.028). Data presented as whisker box plots displaying median and interquartile ranges, and analyzed using Mann-Whitney test.
Figure 5
Figure 5. L–type channels triggered mitochondrial oxidant stress in LC
(a) Mito–roGFP positive LC neuron immunoreactive to tyrosine hydroxylase (TH). (b) Mito-roGFP calibration with relative oxidation of 0.4. Isradipine attenuated oxidation in a dose-dependent manner (n=5 neurons control, 5 mice, n=4 neurons 200 nM isradipine, 4 mice, p=0.028; n=5 neurons 1 μM isradipine, 4 mice, p=0.002). Ryanodine (n=6 neurons, 5 mice, p=0.001) and Ru360 (n=4 neurons,4 mice, p=0.007) also attenuated mitochondrial oxidation. (c) Ca2+ entry through L–channels is pumped into ER via the sarcoendoplasmic reticulum Ca2+ ATPase (SERCA). Mitochondrial–associated–membranes (MAMs) allow Ca2+release from inositol–1,4,5–trisphosphate receptors (IP3Rs) and RyRs into the mitochondria through MCU. (d)Mitochondrial–membrane potential (MMP) oscillations of LC and SNc neurons using TMRM. (e) UCPs antagonized with genipin (100 μM) attenuated the amplitude (p=0.031) and frequency (p=0.016) of MMP oscillations. (f) Isradipine decreased the amplitude (p=0.047) and frequency (p=0.017) of MMP oscillations. Panel e–f , n=6 neurons, 3 mice per antagonist, Wilcoxon–matched pairs signed rank test. (g) Loss of DJ–1 function (DJ–1−/−) exacerbated mitochondrial oxidant stress in DJ–1−/− (red) compared to WT (p=0.029, n=4 WT neurons, 3 mice, n=4 DJ–1−/− neurons, 3 mice). Neurons with 1 μM isradipine (green) for 1 hr attenuated oxidant stress in DJ–1−/− (p=0.032, n=5 DJ–1−/− neurons with isradipine, 3 mice), Data presented as whisker box plots with median and interquartile ranges, and analyzed using Mann-Whitney test compared to control.
Figure 6
Figure 6. Modulation of spiking and mitochondrial oxidant stress
(a) Muscimol (10 μM, MUS) silenced pacemaking whereas orexin (500 nM) nearly doubled spike rate compared to control (n=4 neurons from 2 mice with MUS, p=0.002; n=8 neurons orexin from 8 mice, p=0.022,). (b) Muscimol and orexin decreased relative oxidation in LC neurons (n=5 control neurons from 5 mice; n=4 neurons with MUS from 3 mice, p=0.003; n=6 orexin-treated neurons from 3 mice, p=0.010). (c) Orexin attenuated spikelet amplitude in LC neurons (n=4 neurons from 4 mice, p=0.038). (d) Dendritic Ca2+ traces averaged from pacemaking–triggered Ca2+ transients before and after bath application of orexin. Orexin decreased the amplitude of dendritic Ca2+ transients despite an increase in spike rate (n=4 neurons from 4 mice, p=0.014). (e) Pacemaking firing in LC neurons recorded in cell–attached mode under control conditions of 95% oxygen and 5% carbon dioxide, pH 7.4, or hypercapnia, induced by bubbling ACSF with a gas mixture of 85% oxygen and 15% carbon dioxide. From the 3 neurons (from 3 mice) recorded before and after hypercapnia, all three neurons increased spike rate under hypercapnic conditions (p=0.038). (f) LC neurons exposed to 1 hour of hypercapnia (n=8 neurons from 3 mice, p=0.023) displayed increased mitochondrial oxidant stress when compared to control neurons (n=5 neurons from 3 mice). Data presented as whisker box plots displaying median and interquartile ranges, and analyzed using Mann-Whitney test comparing to respective controls.
Figure 7
Figure 7. Nitric oxide synthase contributed to oxidant stress
(a) LC neurons labeled with the nitric oxide (NO) fluorescent probe DAF–FM with 100 μM L–NAME relative to control (n=3 mice). L–NAME attenuated NO production shown as decreased DAF-FM fluorescence. (b) NO production was decreased with isradipine (1 μM) or Ru360 (10 μM) (n=7 neurons isradipine, p=0.002; n=8 neurons Ru360, p=0.002, data collected from 3 mice). Antagonism of mitochondrial Na+–Ca2+ exchange (NCX) with 5 μM CGP37157 led to enhanced production of NO (n=6 neurons from 3 mice with CGP37157, p=0.001). Schematic displays the signals tracing Cav1 channel-mediated Ca2+ entry to increased intramitochondrial Ca2+. Ca2+-induced stimulation of NO impairs ETC and leads to generation of mitochondrial oxidant stress. (c) NOS inhibition in SNc and LC neurons decrease mitochondrial oxidant stress (n=7 control SNc neurons from 5 mice, n=6 L–NAME–treated SNc neurons from 5 mice, p<0.001; n=6 L–NAME–treated LC neurons from 4 mice, p=0.007). Control relative oxidation values of LC neurons were replotted from fig. 5b for comparison purposes. A different NOS inhibitor, L–NNA (10 μM) also decreased mitochondrial oxidation in LC (n=6 L–NNA treated neurons from 4 mice, p=0.036). (d) L–NAME decreased the amplitude (p=0.029)and frequency (p=0.014)of mitochondrial membrane potential oscillations in LC neurons measured with TMRM (n=4 neurons from 4 mice). Data presented as whisker box plots displaying median and interquartile ranges, and analyzed using Mann-Whitney test relative to controls.

Comment in

  • Pacemaker's burden.
    Cho M. Cho M. Nat Neurosci. 2014 Jun;17(6):755. doi: 10.1038/nn0614-755. Nat Neurosci. 2014. PMID: 24866040 No abstract available.

References

    1. Aston–Jones G, Cohen JD. An integrative theory of locus coeruleus–norepinephrine function: adaptive gain and optimal performance. Annu Rev Neurosci. 2005;28:403–450. - PubMed
    1. Sara SJ. The locus coeruleus and noradrenergic modulation of cognition. Nat Rev Neurosci. 2009;10:211–223. - PubMed
    1. Park A, Stacy M. Non–motor symptoms in Parkinson’s disease. J Neurol. 2009;256(Suppl 3):293–298. - PubMed
    1. Surmeier DJ, Guzman JN, Sanchez–Padilla J. Calcium, cellular aging, and selective neuronal vulnerability in Parkinson’s disease. Cell Calcium. 2010;47:175–182. - PMC - PubMed
    1. Nicholls DG. Oxidative stress and energy crises in neuronal dysfunction. Ann N Y Acad Sci. 2008;1147:53–60. - PubMed

Publication types

Substances