Mammographic density phenotypes and risk of breast cancer: a meta-analysis
- PMID: 24816206
- PMCID: PMC4568991
- DOI: 10.1093/jnci/dju078
Mammographic density phenotypes and risk of breast cancer: a meta-analysis
Abstract
Background: Fibroglandular breast tissue appears dense on mammogram, whereas fat appears nondense. It is unclear whether absolute or percentage dense area more strongly predicts breast cancer risk and whether absolute nondense area is independently associated with risk.
Methods: We conducted a meta-analysis of 13 case-control studies providing results from logistic regressions for associations between one standard deviation (SD) increments in mammographic density phenotypes and breast cancer risk. We used random-effects models to calculate pooled odds ratios and 95% confidence intervals (CIs). All tests were two-sided with P less than .05 considered to be statistically significant.
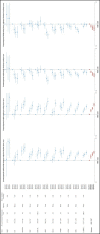
Results: Among premenopausal women (n = 1776 case patients; n = 2834 control subjects), summary odds ratios were 1.37 (95% CI = 1.29 to 1.47) for absolute dense area, 0.78 (95% CI = 0.71 to 0.86) for absolute nondense area, and 1.52 (95% CI = 1.39 to 1.66) for percentage dense area when pooling estimates adjusted for age, body mass index, and parity. Corresponding odds ratios among postmenopausal women (n = 6643 case patients; n = 11187 control subjects) were 1.38 (95% CI = 1.31 to 1.44), 0.79 (95% CI = 0.73 to 0.85), and 1.53 (95% CI = 1.44 to 1.64). After additional adjustment for absolute dense area, associations between absolute nondense area and breast cancer became attenuated or null in several studies and summary odds ratios became 0.82 (95% CI = 0.71 to 0.94; P heterogeneity = .02) for premenopausal and 0.85 (95% CI = 0.75 to 0.96; P heterogeneity < .01) for postmenopausal women.
Conclusions: The results suggest that percentage dense area is a stronger breast cancer risk factor than absolute dense area. Absolute nondense area was inversely associated with breast cancer risk, but it is unclear whether the association is independent of absolute dense area.
© The Author 2014. Published by Oxford University Press. All rights reserved. For Permissions, please e-mail: journals.permissions@oup.com.
Figures


Comment in
-
Comparing mammographic measures across populations.J Natl Cancer Inst. 2014 May 10;106(5):dju109. doi: 10.1093/jnci/dju109. J Natl Cancer Inst. 2014. PMID: 24816205 No abstract available.
References
-
- McCormack VA, dos Santos Silva I. Breast density and parenchymal patterns as markers of breast cancer risk: a meta-analysis. Cancer Epidemiol Biomarkers Prev. 2006;15(6):1159–1169. - PubMed
-
- Trichopoulos D, Lipman RD. Mammary gland mass and breast cancer risk. Epidemiology. 1992;3(6):523–526. - PubMed
-
- Kato I, Beinart C, Bleich A, Su S, Kim M, Toniolo PG. A nested case–control study of mammographic patterns, breast volume, and breast cancer. Cancer Causes Control. 1995;6(5):431–438. - PubMed
-
- Boyd N, Martin L, Gunasekara A, et al. Mammographic density and breast cancer risk: evaluation of a novel method of measuring breast tissue volumes. Cancer Epidemiol Biomarkers Prev. 2009;18(6):1754–1762. - PubMed
Publication types
MeSH terms
Grants and funding
- R25 CA098566/CA/NCI NIH HHS/United States
- R01 CA50385/CA/NCI NIH HHS/United States
- 2007MAYPR23/BBC_/Breast Cancer Now/United Kingdom
- P50 CA116201/CA/NCI NIH HHS/United States
- P01 CA87969/CA/NCI NIH HHS/United States
- R01 CA085265/CA/NCI NIH HHS/United States
- R01 CA131332/CA/NCI NIH HHS/United States
- R01 CA128931/CA/NCI NIH HHS/United States
- R01 CA97396/CA/NCI NIH HHS/United States
- R03 CA135699/CA/NCI NIH HHS/United States
- R37 CA054281/CA/NCI NIH HHS/United States
- 14565/CRUK_/Cancer Research UK/United Kingdom
- P30 CA015083/CA/NCI NIH HHS/United States
- R01 CA124865/CA/NCI NIH HHS/United States
- R01 CA140286/CA/NCI NIH HHS/United States
- P30 CA071789/CA/NCI NIH HHS/United States
- 001/WHO_/World Health Organization/International
LinkOut - more resources
Full Text Sources
Other Literature Sources
Medical
Molecular Biology Databases

