. 2014 Jun;46(6):543-550.
doi: 10.1038/ng.2982. Epub 2014 May 11.

An atlas of genetic influences on human blood metabolites

Affiliations

An atlas of genetic influences on human blood metabolites

So-Youn Shin et al. Nat Genet. 2014 Jun.

Abstract

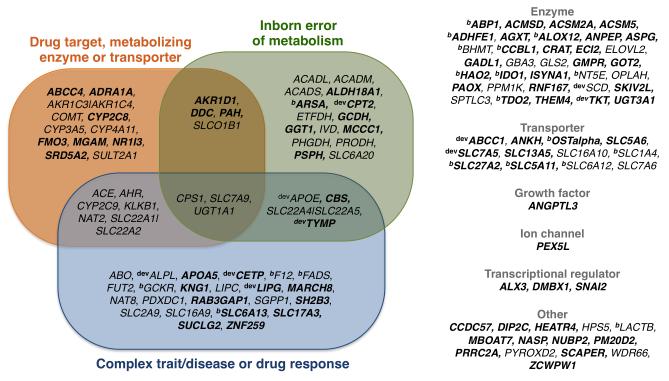
Genome-wide association scans with high-throughput metabolic profiling provide unprecedented insights into how genetic variation influences metabolism and complex disease. Here we report the most comprehensive exploration of genetic loci influencing human metabolism thus far, comprising 7,824 adult individuals from 2 European population studies. We report genome-wide significant associations at 145 metabolic loci and their biochemical connectivity with more than 400 metabolites in human blood. We extensively characterize the resulting in vivo blueprint of metabolism in human blood by integrating it with information on gene expression, heritability and overlap with known loci for complex disorders, inborn errors of metabolism and pharmacological targets. We further developed a database and web-based resources for data mining and results visualization. Our findings provide new insights into the role of inherited variation in blood metabolic diversity and identify potential new opportunities for drug development and for understanding disease.


Figures

Figure 1
Figure 1. Ideogram of metabolomic associations
Chromosomal map illustrating the location of the 145 loci identified in this study. Locus label colors are indicative of metabolite pathway class for the strongest associated metabolite at each locus, and are carried through additional figures and in the corresponding Cytoscape file (see URLs). An interactive web version of this figure at the supporting online website (see URLs) provides an entry point to biologic and functional annotation for each locus.
Figure 2
Figure 2. A network view of genetic and metabolic associations
The network view was built by combining genetic associations with a GGM network created from metabolite concentrations. A. Each node represents either a set of metabolites belonging to the same pathway (circular nodes) or a genetic locus (diamond-shaped nodes). An edge between a pathway and a locus was drawn if at least one metabolite showed a genome-wide significant association with the locus. A line between two pathway nodes was drawn if there was at least one connection in the underlying metabolite GGM network between two metabolites of the respective pathways (see Online Methods). Node color keys are the same as in Figure 1. Numbers within metabolite loci indicate pathway name as detailed in the legend. Numbers associated with each pathway name indicate the number of metabolites contained within each pathway node. B. Example of a network with full-detail resolution. The network is provided in digital form for interactive viewing at the supporting online website (see URLs). The fully annotated network is also available for download in Cytoscape format from the same website.
Figure 3
Figure 3. Heritability and variance explained
We used the ACE model to partition the variance of each metabolite into narrow-sense heritability (orange), and common (purple) and unique environmental components. The proportion of heritability explained by all SNPs associated with a given metabolite at the genome-wide level is shown in red. The corresponding numeric values for heritability estimates are given in Supplementary Table 7.
Figure 4
Figure 4. Epistatic effects and Mendelian randomization analyses on eQTL loci
(A) Interaction between NAT8 and PYROXD2 variants. Levels of the metabolite X-12093 are plotted as a function of genotypes at the two variants rs10469966 (NAT8) and rs4488133 (PYROXD2), showing a significant SNP*SNP interaction on metabolite levels. See also Supplementary Figure 4. (B) Regional plots illustrating overlap of association of SNPs with metabolites (red) and gene expression levels measured in fat (black), skin (blue) and LCLs (green) at locus 11. Associations p-values (–log10 scale) are plotted for a 1 Mb window surrounding the lead SNP rs6693388, and for associations of the SNP with linoleate (18:2n6)/ 5,8-tetradecadienoate (red), and with THEM4 expression in fat (black), skin (blue) and LCL (green) respectively. (C) Example of relationships tested by Mendelian randomization analysis at the same locus, where expression of gene THEM4 is shown to mediate the association between rs6693388 and the ratio linoleate (18:2n6) to 5,8-tetradecadienoate. All analyses were done in a subset of 484 unrelated TwinsUK participants with gene expression measured at the same time of visit of metabolomic measurements. The full results are in Supplementary Table 11.
Figure 5
Figure 5. Medical and pharmacological relevance of metabolomic associations
Genes reported in Supplementary Table 4 were classified based on their overlap with inborn errors of metabolism, or for being targets, metabolizing enzymes or transporters of FDA-approved drugs. Variants were annotated based on their overlap with complex trait and disease loci. Novel associations reported for the first time in this study are highlighted in bold. The symbols dev and b identify genes associated with compounds in active stages of drug development (preclinical, Phase I-III, pre-registration to registration) and bioactive drug-like compounds respectively. Full details on locus annotation are provided in Supplementary Tables 6, 13 and 14 and in the full version available on the supporting online website (see URLs).

Comment in

References

    1. Garrod AE. Inborn Factors in Disease. Oxford University Press; 1931.
    1. Kettunen J, et al. Genome-wide association study identifies multiple loci influencing human serum metabolite levels. Nature Genetics. 2012;44:269–276. - PMC - PubMed
    1. Sabatine MS, et al. Metabolomic identification of novel biomarkers of myocardial ischemia. Circulation. 2005;112:3868–75. - PubMed
    1. Holmes E, et al. Human metabolic phenotype diversity and its association with diet and blood pressure. Nature. 2008;453:396–400. - PMC - PubMed
    1. Sreekumar A, et al. Metabolomic profiles delineate potential role for sarcosine in prostate cancer progression. Nature. 2009;457:910–914. - PMC - PubMed

Online References

    1. Moayyeri A, Hammond CJ, Hart DJ, Spector TD. The UK Adult Twin Registry (TwinsUK Resource) Twin Res Hum Genet. 2013;16:144–149. - PMC - PubMed
    1. Wichmann HE, Gieger C, Illig T. KORA-gen--resource for population genetics, controls and a broad spectrum of disease phenotypes. Gesundheitswesen. 2005;67(Suppl 1):S26–30. - PubMed
    1. Abecasis GR, Cherny SS, Cookson WO, Cardon LR. Merlin--rapid analysis of dense genetic maps using sparse gene flow trees. Nat Genet. 2002;30:97–101. - PubMed
    1. Kutalik Z, Whittaker J, Waterworth D, Beckmann JS, Bergmann S. Novel method to estimate the phenotypic variation explained by genome-wide association studies reveals large fraction of the missing heritability. Genet Epidemiol. 2011;35:341–9. - PubMed
    1. Willer CJ, Li Y, Abecasis GR. METAL: fast and efficient meta-analysis of genomewide association scans. Bioinformatics. 2010;26:2190–1. - PMC - PubMed

Publication types

MeSH terms