

Three dimensional cellular microarray platform for human neural stem cell differentiation and toxicology
- PMID: 24816401
- PMCID: PMC4090259
- DOI: 10.1016/j.scr.2014.04.004
Three dimensional cellular microarray platform for human neural stem cell differentiation and toxicology
Abstract
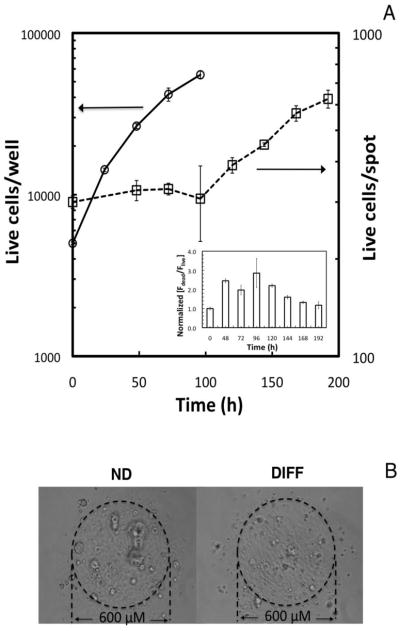
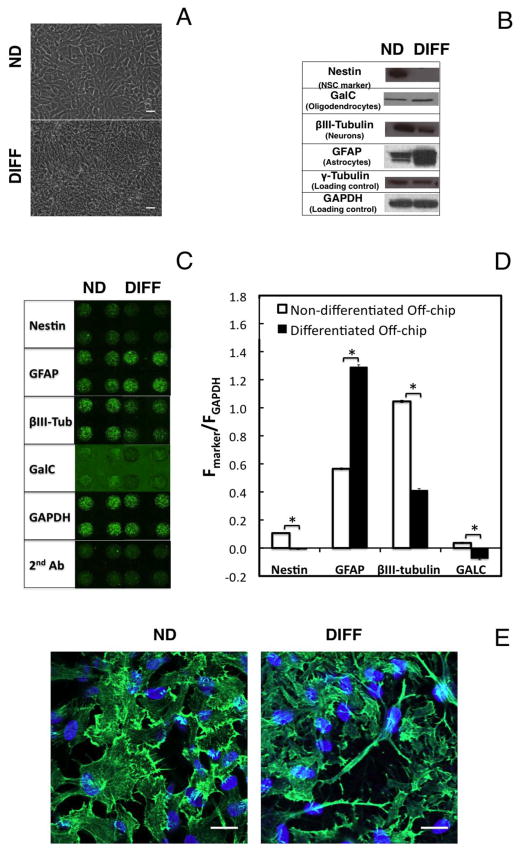
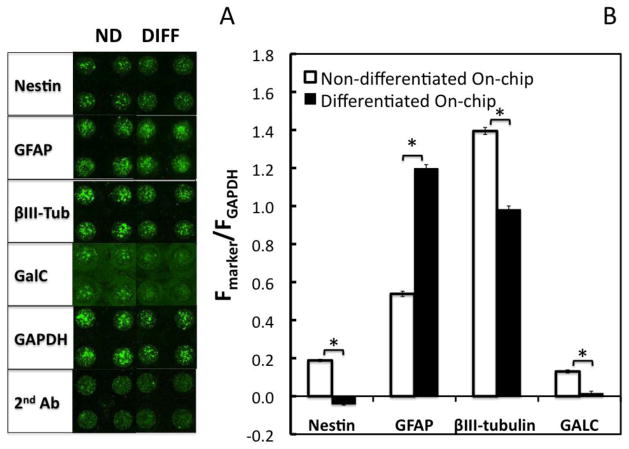
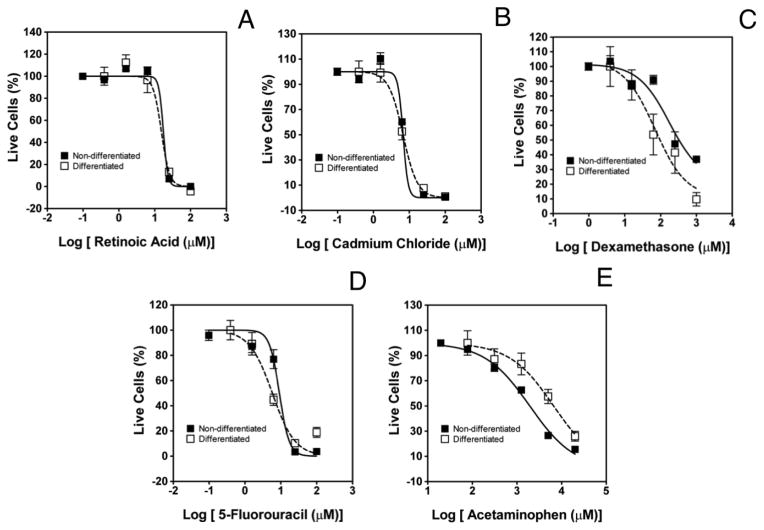
We developed a three-dimensional (3D) cellular microarray platform for the high-throughput (HT) analysis of human neural stem cell (hNSC) growth and differentiation. The growth of an immortalized hNSC line, ReNcell VM, was evaluated on a miniaturized cell culture chip consisting of 60nl spots of cells encapsulated in alginate, and compared to standard 2D well plate culture conditions. Using a live/dead cell viability assay, we demonstrated that the hNSCs are able to expand on-chip, albeit with lower proliferation rates and viabilities than in conventional 2D culture platforms. Using an in-cell, on-chip immunofluorescence assay, which provides quantitative information on cellular levels of proteins involved in neural fate, we demonstrated that ReNcell VM can preserve its multipotent state during on-chip expansion. Moreover, differentiation of the hNSCs into glial progeny was achieved both off- and on-chip six days after growth factor removal, accompanied by a decrease in the neural progenitor markers. The versatility of the platform was further demonstrated by complementing the cell culture chip with a chamber system that allowed us to screen for differential toxicity of small molecules to hNSCs. Using this approach, we showed differential toxicity when evaluating three neurotoxic compounds and one antiproliferative compound, and the null effect of a non-toxic compound at relevant concentrations. Thus, our 3D high-throughput microarray platform may help predict, in vitro, which compounds pose an increased threat to neural development and should therefore be prioritized for further screening and evaluation.
Copyright © 2014. Published by Elsevier B.V.
Figures
Similar articles
-
3D-cultured neural stem cell microarrays on a micropillar chip for high-throughput developmental neurotoxicology.Exp Cell Res. 2018 Sep 15;370(2):680-691. doi: 10.1016/j.yexcr.2018.07.034. Epub 2018 Jul 24. Exp Cell Res. 2018. PMID: 30048616
-
Enhancement of human neural stem cell self-renewal in 3D hypoxic culture.Biotechnol Bioeng. 2017 May;114(5):1096-1106. doi: 10.1002/bit.26224. Epub 2016 Nov 29. Biotechnol Bioeng. 2017. PMID: 27869294
-
Three-dimensional cell culture microarray for high-throughput studies of stem cell fate.Biotechnol Bioeng. 2010 May 1;106(1):106-18. doi: 10.1002/bit.22661. Biotechnol Bioeng. 2010. PMID: 20069558 Free PMC article.
-
Coating Materials for Neural Stem/Progenitor Cell Culture and Differentiation.Stem Cells Dev. 2020 Apr 15;29(8):463-474. doi: 10.1089/scd.2019.0288. Epub 2020 Mar 31. Stem Cells Dev. 2020. PMID: 32106778 Review.
-
Scaffolds for 3D in vitro culture of neural lineage cells.Acta Biomater. 2017 May;54:1-20. doi: 10.1016/j.actbio.2017.02.046. Epub 2017 Mar 1. Acta Biomater. 2017. PMID: 28259835 Review.
Cited by
-
Living Cell Microarrays: An Overview of Concepts.Microarrays (Basel). 2016 May 26;5(2):11. doi: 10.3390/microarrays5020011. Microarrays (Basel). 2016. PMID: 27600077 Free PMC article. Review.
-
Tuning Physicochemical Properties of a Macroporous Polysaccharide-Based Scaffold for 3D Neuronal Culture.Int J Mol Sci. 2021 Nov 25;22(23):12726. doi: 10.3390/ijms222312726. Int J Mol Sci. 2021. PMID: 34884531 Free PMC article.
-
TAZ Represses the Neuronal Commitment of Neural Stem Cells.Cells. 2020 Oct 2;9(10):2230. doi: 10.3390/cells9102230. Cells. 2020. PMID: 33023162 Free PMC article.
-
A 3D bioinspired highly porous polymeric scaffolding system for in vitro simulation of pancreatic ductal adenocarcinoma.RSC Adv. 2018 Jun 7;8(37):20928-20940. doi: 10.1039/c8ra02633e. eCollection 2018 Jun 5. RSC Adv. 2018. PMID: 35542351 Free PMC article.
-
High-Throughput Toxicity and Phenotypic Screening of 3D Human Neural Progenitor Cell Cultures on a Microarray Chip Platform.Stem Cell Reports. 2016 Nov 8;7(5):970-982. doi: 10.1016/j.stemcr.2016.10.001. Epub 2016 Oct 27. Stem Cell Reports. 2016. PMID: 28157485 Free PMC article.
References
-
- Adams J, Lammer EJ. Relationship between dysmorphology and neuropsychological function in children exposed to isotretinoin “in utero”. In: Fujii T, Boer CJ, editors. Functional Neuroteratology of Short-Term Exposure to Drugs. Tokyo: Teikyo University Press; 1991. pp. 59–70.
-
- Andersen ME, Krewski D. Toxicity testing in the 21st century: bringing the vision to life. Toxicological sciences : an official journal of the Society of Toxicology. 2009;107(2):324–30. - PubMed
-
- Ashton RS, et al. Scaffolds based on degradable alginate hydrogels and poly(lactide-co-glycolide) microspheres for stem cell culture. Biomaterials. 2007;28(36):5518–5525. - PubMed
-
- Bal-Price AK, et al. Relevance of in vitro neurotoxicity testing for regulatory requirements: challenges to be considered. Neurotoxicology and teratology. 2010;32(1):36–41. - PubMed
Publication types
MeSH terms
Grants and funding
LinkOut - more resources
Full Text Sources
Other Literature Sources
