

Assessment of metabolomic and proteomic biomarkers in detection and prognosis of progression of renal function in chronic kidney disease
- PMID: 24817014
- PMCID: PMC4016198
- DOI: 10.1371/journal.pone.0096955
Assessment of metabolomic and proteomic biomarkers in detection and prognosis of progression of renal function in chronic kidney disease
Abstract
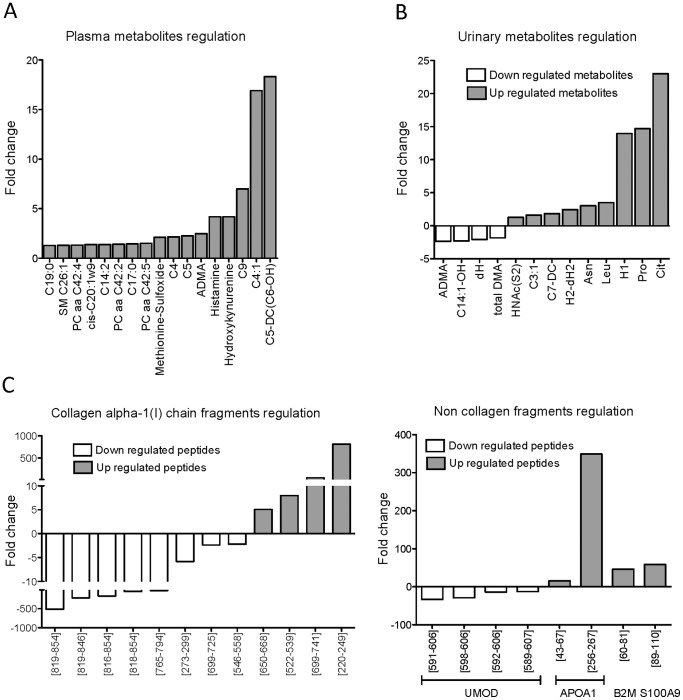
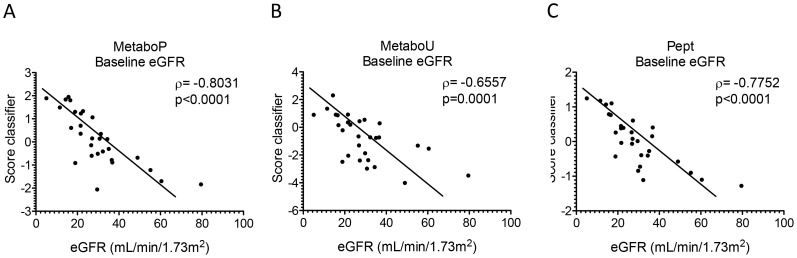
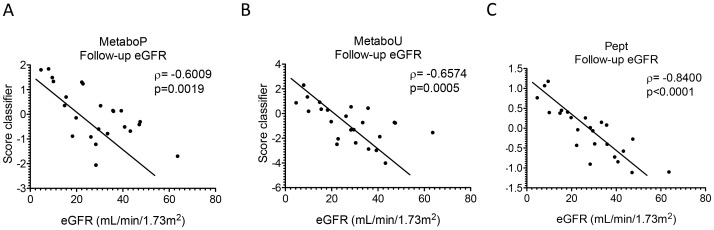
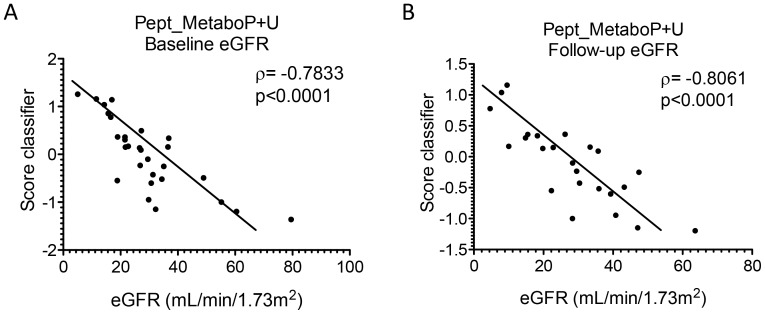
Chronic kidney disease (CKD) is part of a number of systemic and renal diseases and may reach epidemic proportions over the next decade. Efforts have been made to improve diagnosis and management of CKD. We hypothesised that combining metabolomic and proteomic approaches could generate a more systemic and complete view of the disease mechanisms. To test this approach, we examined samples from a cohort of 49 patients representing different stages of CKD. Urine samples were analysed for proteomic changes using capillary electrophoresis-mass spectrometry and urine and plasma samples for metabolomic changes using different mass spectrometry-based techniques. The training set included 20 CKD patients selected according to their estimated glomerular filtration rate (eGFR) at mild (59.9±16.5 mL/min/1.73 m2; n = 10) or advanced (8.9±4.5 mL/min/1.73 m2; n = 10) CKD and the remaining 29 patients left for the test set. We identified a panel of 76 statistically significant metabolites and peptides that correlated with CKD in the training set. We combined these biomarkers in different classifiers and then performed correlation analyses with eGFR at baseline and follow-up after 2.8±0.8 years in the test set. A solely plasma metabolite biomarker-based classifier significantly correlated with the loss of kidney function in the test set at baseline and follow-up (ρ = -0.8031; p<0.0001 and ρ = -0.6009; p = 0.0019, respectively). Similarly, a urinary metabolite biomarker-based classifier did reveal significant association to kidney function (ρ = -0.6557; p = 0.0001 and ρ = -0.6574; p = 0.0005). A classifier utilising 46 identified urinary peptide biomarkers performed statistically equivalent to the urinary and plasma metabolite classifier (ρ = -0.7752; p<0.0001 and ρ = -0.8400; p<0.0001). The combination of both urinary proteomic and urinary and plasma metabolic biomarkers did not improve the correlation with eGFR. In conclusion, we found excellent association of plasma and urinary metabolites and urinary peptides with kidney function, and disease progression, but no added value in combining the different biomarkers data.
Conflict of interest statement
Figures
References
-
- National Kidney Foundation (2002) K/DOQI clinical practice guidelines for chronic kidney disease: evaluation, classification, and stratification. Am J Kidney Dis 39: S1–S226. - PubMed
-
- Miller WG, Bruns DE, Hortin GL, Sandberg S, Aakre KM, et al. (2009) Current issues in measurement and reporting of urinary albumin excretion. Clin Chem 55: 24–38. - PubMed
-
- Allison SJ (2013) Chronic kidney disease: The effect of age on CKD outcomes. Nat Rev Nephrol 9: 3. - PubMed
-
- Deininger SO, Ebert MP, Futterer A, Gerhard M, Rocken C (2008) MALDI imaging combined with hierarchical clustering as a new tool for the interpretation of complex human cancers. J Proteome Res 7: 5230–5236. - PubMed
Publication types
MeSH terms
Substances
LinkOut - more resources
Full Text Sources
Other Literature Sources
Medical
Research Materials
Miscellaneous
