. 2014 May 9;9(5):e97148.
doi: 10.1371/journal.pone.0097148. eCollection 2014.

Mycobacterium tuberculosis proteins involved in mycolic acid synthesis and transport localize dynamically to the old growing pole and septum

Affiliations

Mycobacterium tuberculosis proteins involved in mycolic acid synthesis and transport localize dynamically to the old growing pole and septum

Clément Carel et al. PLoS One. .

Abstract

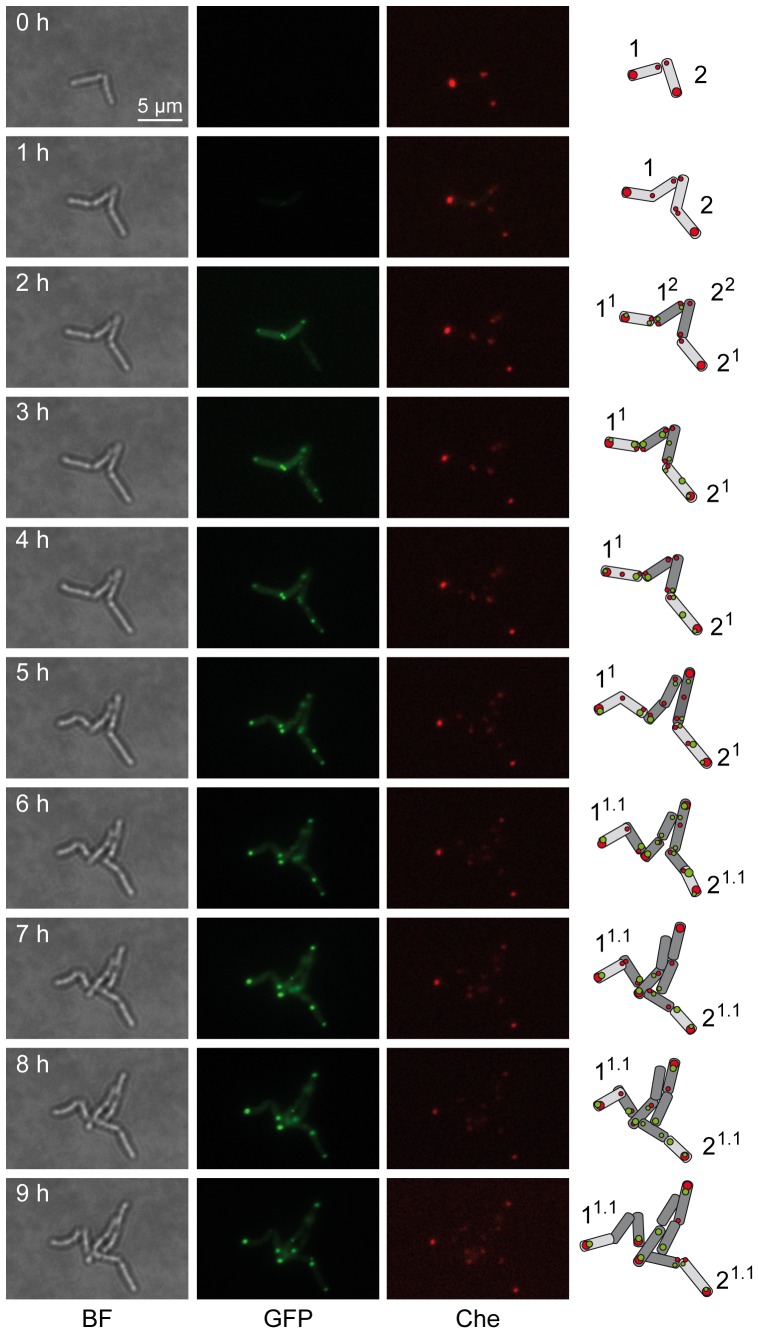
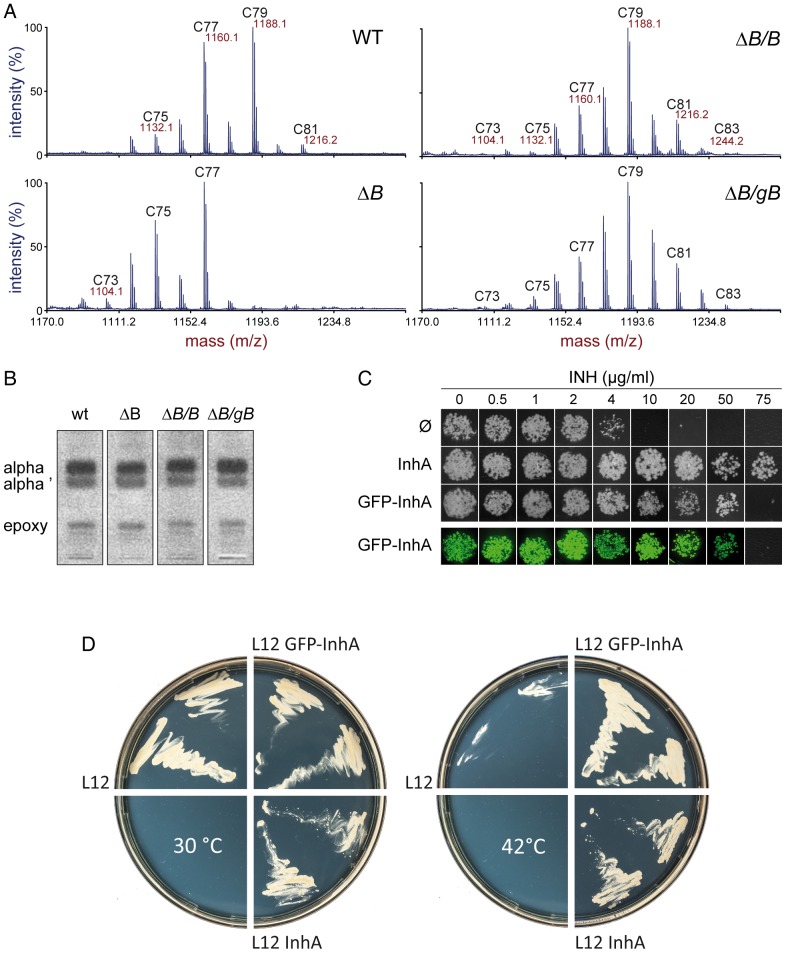
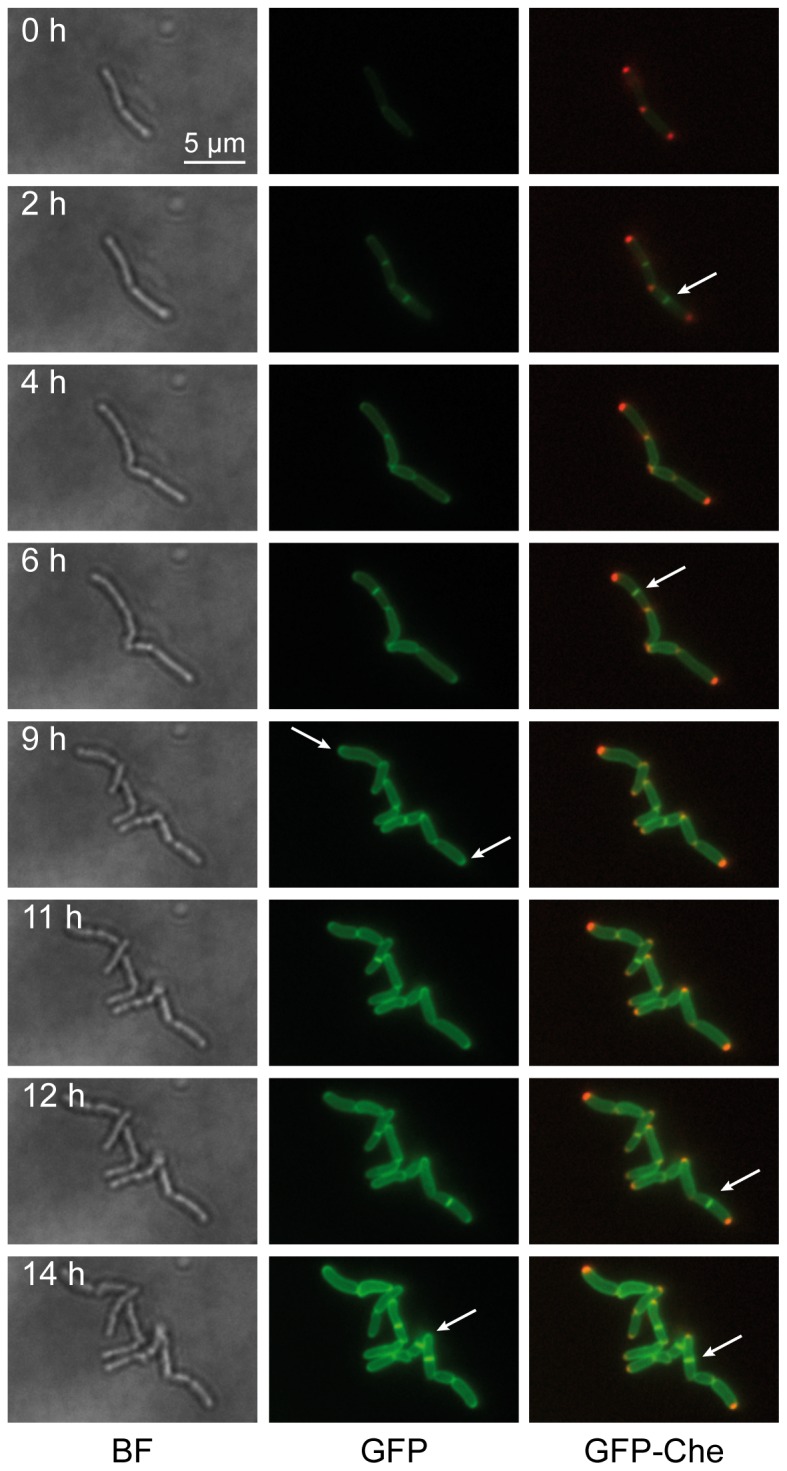
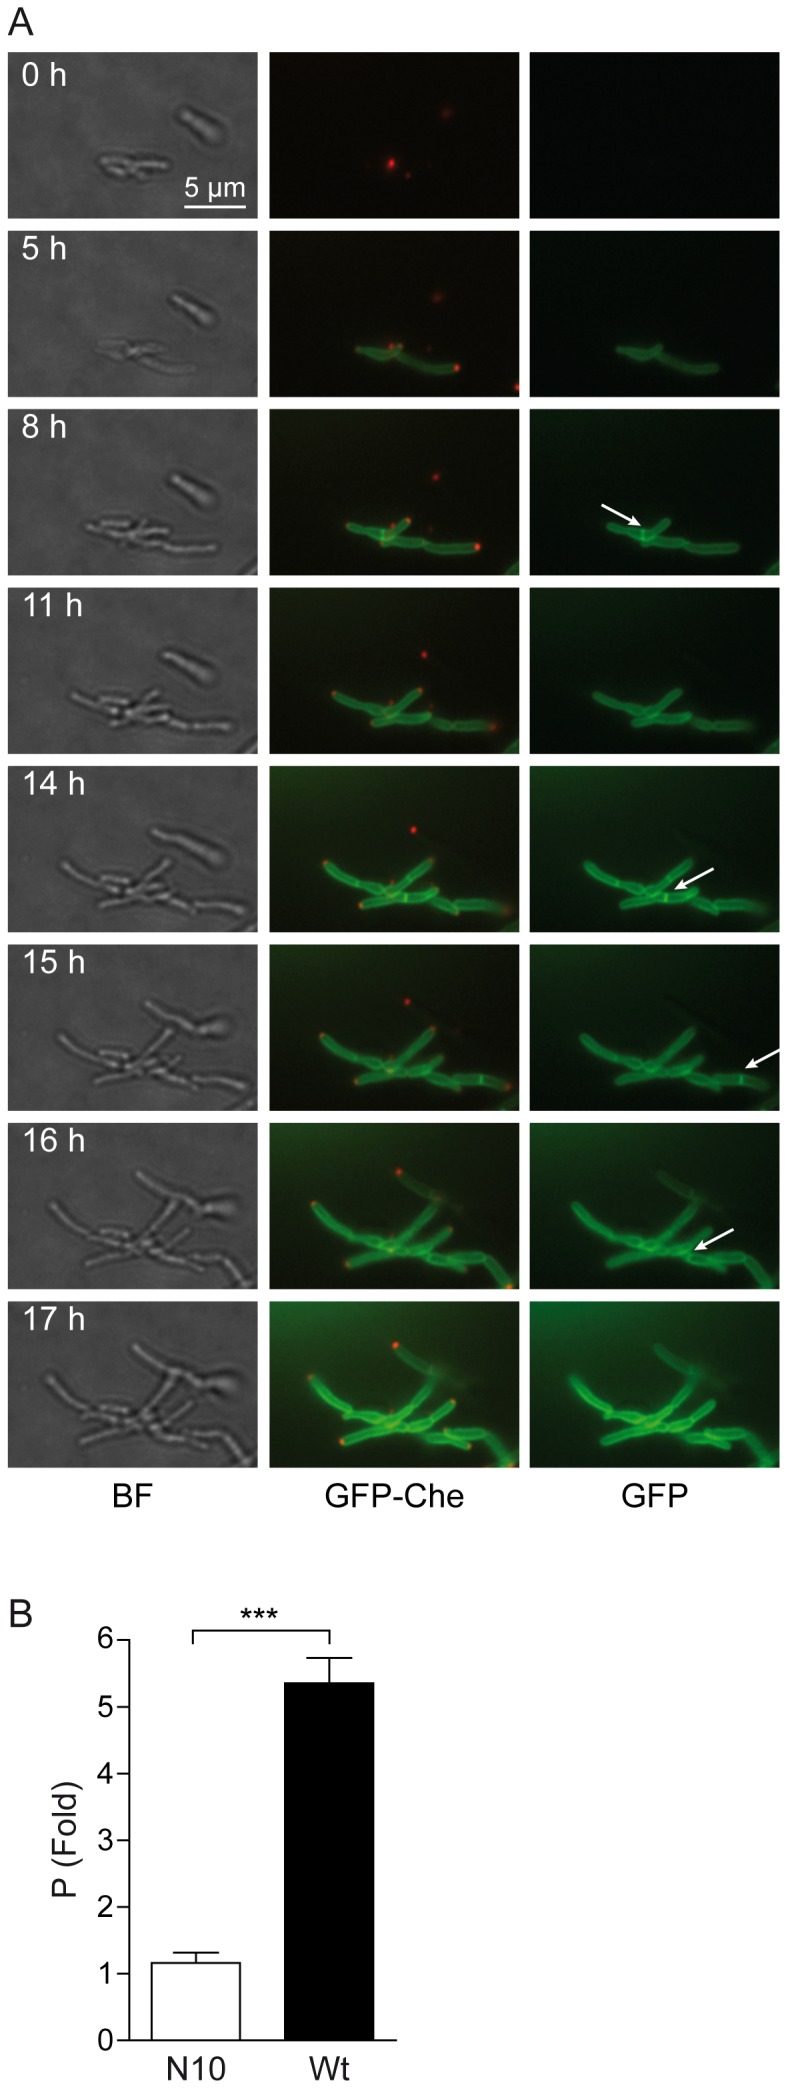
Understanding the mechanism that controls space-time coordination of elongation and division of Mycobacterium tuberculosis (Mtb), the causative agent of tuberculosis (TB), is critical for fighting the tubercle bacillus. Most of the numerous enzymes involved in the synthesis of Mycolic acid - Arabinogalactan-Peptidoglycan complex (MAPc) in the cell wall are essential in vivo. Using a dynamic approach, we localized Mtb enzymes belonging to the fatty acid synthase-II (FAS-II) complexes and involved in mycolic acid (MA) biosynthesis in a mycobacterial model of Mtb: M. smegmatis. Results also showed that the MA transporter MmpL3 was present in the mycobacterial envelope and was specifically and dynamically accumulated at the poles and septa during bacterial growth. This localization was due to its C-terminal domain. Moreover, the FAS-II enzymes were co-localized at the poles and septum with Wag31, the protein responsible for the polar localization of mycobacterial peptidoglycan biosynthesis. The dynamic localization of FAS-II and of the MA transporter with Wag31, at the old-growing poles and at the septum suggests that the main components of the mycomembrane may potentially be synthesized at these precise foci. This finding highlights a major difference between mycobacteria and other rod-shaped bacteria studied to date. Based on the already known polar activities of envelope biosynthesis in mycobacteria, we propose the existence of complex polar machinery devoted to the biogenesis of the entire envelope. As a result, the mycobacterial pole would represent the Achilles' heel of the bacillus at all its growing stages.


Conflict of interest statement

Competing Interests: The authors have declared that no competing interests exist.

Figures

Figure 1
Figure 1. Schematic representation of mycobacterial polar growth and establishment of bacterial poles.
Two division cycles (D1 and D2) are presented. The active biosynthesis of lateral peptidoglycan at the poles and biosynthesis of septal peptidoglycan at the future pole (septal poles) are symbolized with curved arrows. The old pole (in red) and the new pole (in blue); are both represented and refer to the first division event (D1).
Figure 2
Figure 2. Polar localization of FAS-II proteins.
(A) Enlarged images of wide-field microscopy experiments on GFP-fusion expressing bacteria. Bright field images (BF; leftmost column) together with GFP fluorescence images (GFP, middle column) of Msm expressing GFP fusions with MabA, InhA, KasA or KasB, or GFP alone (Ø) were acquired after 6 hours of induction. The merged images (right columns) allowed visualizing the polar localization of the fusions. Total optical magnification: 630 X. Scale bar: 5 µm. (B) Scatter dot plot representation of polar indexes of Msm strains expressing each GFP fusion after 6 hours of induction. Data were collected from wide-field microscopy images and subsequently expressed and evaluated as described in Materials and Methods. Statistical t-tests were performed to assess the differences between the polar indices of GFP-MabA (black circles) and GFP-InhA (black triangles) and between GFP-KasA (black squares) and GFP-KasB (open diamonds). Each data point corresponds to an individual experiment. Each series of data points for a given fusion represents 500 to1500 bacteria analyzed. The p values of indicated unpaired t-tests are symbolized by asterisks (***, p<0.0001), (*, p = 0.0264). (C) Total fluorescence of Msm cultures expressing GFP fusions. Experimental values are represented as means ± SEM. Fluorescence intensities, expressed in RFU (as defined in the text and in the Materials and Methods) of liquid cultures of Msm expressing either GFP alone (Ø), GFP-MabA (black circles), GFP-KasB (open diamonds), GFP-KasA (black squares) or GFP-InhA (black triangles) were plotted against the length of induction in hours (h). The curve fit was obtained by using a second order polynomial nonlinear regression (quadratic) calculated with GraphPad Prism 5.0 software. (D) Western Blot analysis of GFP-fusions. Total protein content of Msm culture samples expressing either GFP alone or the GFP-fusions with the indicated proteins was analyzed by Western blotting using anti-GFP antibodies. The blots were performed 2 hours (left lanes), 4 hours (middle lanes) or 6 hours (right lanes) after acetamide induction of the same cultures depicted in panel C. The molecular weights of the relevant marker bands are indicated in kDa.
Figure 3
Figure 3. Dynamics of GFP-MabA localization.
Images were extracted from the movie presented as movie S2. The time interval after the starting point of the movie is indicated in hour (h). Merge bright field and GFP channel images (BF-GFP, left column) and GFP channel images (GFP, right column) were extracted in order to follow the dynamics of representative GFP-MabA foci. Two bacteria and their daughter cells were schematized (far right). Representative foci (in green) are labeled (a to f) and followed, when possible, in the daughter cells. Superscript numbering represents potential foci splitting. White arrows indicate the localization of the main foci on GFP images. Magnification and scale are identical to those indicated in Figure 2A.
Figure 4
Figure 4. Polar colocalization of FAS-II proteins with Wag31.
(A) Enlarged images of wide-field microscopy experiments on GFP-fusion and mCherry-Wag31 fusion-expressing bacteria. GFP fluorescence images (GFP; leftmost column) together with mCherry fluorescence images (Che, middle column) of Msm::mCherry-wag31 expressing GFP fusions with MabA, InhA, KasA, KasB, or GFP alone (Ø) were acquired after 6 hours of induction. The merged images (right columns) allowed visualizing the polar colocalization of the fusions. Magnification and scale bars are identical to those indicated in Figure? 2A. (B) Bar graph representation of GFP polar indices of Msm::mCherry-wag31 strains expressing each GFP fusion after 6 hours of induction. Experimental values are represented as mean ± SD. Data were processes as described in Figure? 2B. Statistical t-tests were performed to determine the differences between the polar indices of GFP-InhA (dark grey bar) and GFP-KasA (light grey bar) and of GFP-KasA and GFP-KasB (white bar). The p values of indicated unpaired t-tests are symbolized by asterisks (*, p = 0.0271 for InhA-KasA), (*, p = 0.0186 for KasA-KasB). (C) Bar graph representation of GFP-mCherry colocalization indices of Msm::mCherry-wag31 strains expressing each GFP fusion after 6 hours of induction. Experimental values are represented as means ± SD. Data were processed as in panel B; no significant differences were found between colocalization indices. (D) Analysis of maximal mCherry-Wag31 (Che-Wag31, left column) and GFP-FAS-II fusion (GFP fusion, right column) fluorescence position within individual Msm::mCherry-wag31 bacteria expressing each GFP fusion after 6 hours of induction. Each type of bacterium was scanned on both channels. Each dot represents the position of maximum fluorescence of the scans expressed in % of the highest values. Each dot was plotted against its position in the bacterium with the length of bacteria reported to 1. The names of the FAS-II proteins fused with GFP are indicated. Ø refers to the Msm::mCherry-wag31 strain containing GFP alone.
Figure 5
Figure 5. Dynamic of GFP-MabA/Wag31 colocalization.
Images were extracted from the movie presented as movie S7. The time interval after the starting point of the movie is indicated in hours (h). Images were extracted from three channels (bright field, BF, left column; GFP, middle column; mCherry, Che, right column) in order to follow the dynamics of representative GFP-MabA and mCherry-Wag31 foci. Two bacteria, numbered 1 and 2, and their daughter cells, identified by superscript numbering are schematized on the right. Magnification: 630 X. Scale bar: 5 µm.
Figure 6
Figure 6. Analysis of GFP-KasB and GFP-InhA in vivo activities.
(A) MALDI-TOF mass spectra of α-mycolic acid methyl esters extracted from wild type (Msm mc2155, WT), mutant (Msm mc2155 ΔkasB, ΔB) and complemented (Msm mc2155 ΔkasB/kasB, ΔB/B; Msm mc2155 ΔkasB/gfp-kasB, ΔB/gB) strains. The accurate masses (m/z), together with the length of the odd carbon-numbered mycolates are indicated. (B) TLC analysis of mycolic acid methyl esters extracted from the strains analyzed and described in Figure? 6A. The migration position of the α-mycolates (alpha), the α'-mycolates (alpha') and of the epoxy-mycolates (epoxy) are indicated. (C) Growth analysis of colonies of Msm mc2155 derivatives spotted onto agar plates containing increasing amounts of isoniazid (INH). Bacterial colonies were photographed either under white light (first three rows) or under blue light illumination allowing to reveal GFP fluorescence (last row). Bacteria containing the vector alone (Ø) or expressing the Mtb inhA gene, or the GFP fusion with InhA are represented. (D) Two colonies of the thermosensitive strain Msm inhA ts containing either the pLAM12 vector (L12), the pLAM12::GFP-InhA plasmid (L12 GFP-InhA) or the pLAM12::InhA plasmid (L12 InhA) were grown at 30°C (left) or 42°C (right) on agar plates containing acetamide (0.2%).
Figure 7
Figure 7. Dynamic localization of MmpL3.
Images were extracted from the movie presented as movie S12. The time interval after the starting point of the movie is indicated in hours (h). Images were extracted from three channels (bright field, BF, left column; GFP, middle column; GFP and mCherry, GFP-Che, right column). The dynamics of the localization of the GFP fusions was followed in Msm::mCherry-wag31 bacteria expressing the MmpL3-GFP fusions. The presence of MmpL3 in septa is indicated by white arrows in the right column. The “croissant”-shaped accumulation of MmpL3 at the poles is indicated by white arrows in the middle column. The position of mCherry-Wag31 at the poles and septa is clearly visible. Magnification: 630 X. Scale bar: 5 µm).
Figure 8
Figure 8. Dynamic localization of MmpL3-N10.
(A) Images were extracted from the movie presented as movie S13. The time interval after the starting point of the movie is indicated in hours (h). Images were extracted from three channels (bright field, BF, left column; GFP and mCherry, GFP-Che, middle column; GFP, right column). The dynamics of the localization of the GFP fusions was followed in Msm::mCherry-wag31 bacteria expressing the MmpL3-N10-GFP fusions. The presence of MmpL3-N10 in septa is indicated by white arrows in the right column. The position of mCherry-Wag31 at the poles and septa is clearly visible. Magnification: 630 X. Scale bar: 5 µm. (B) Bar graph representation of the localization of MmpL3 and MmpL3-N10 in Msm strains expressing each GFP fusion after 6 hours of induction. Data are represented as mean ± SEM. Data were collected from wide-field microscopy images (as in Figure? 7 and Figure? 8A) by scanning individual bacteria at the level of the membrane, the cytoplasm, and the poles as described in the Materials and Methods. The y-axis represents the polar accumulation (P) of either the complete (Wt) or the N-terminal portion (N10) of the MmpL3 transporter. A statistical t-test was performed to determine the difference between the polar accumulation of MmpL3-GFP (black bar, P = 5.353±0.3810 N = 192) and the absence of polar accumulation of MmpL3-N10-GFP (white bar, P = 1.160±0.1572 N = 113), with N indicating the number of bacteria analyzed. The unpaired t-test p value is symbolized by asterisks (***, p<0.0001).

References

    1. Daffe M, Draper P (1998) The envelope layers of mycobacteria with reference to their pathogenicity. Adv Microb Physiol 39: 131–203. - PubMed
    1. Minnikin DE, Kremer L, Dover LG, Besra GS (2002) The methyl-branched fortifications of Mycobacterium tuberculosis. Chem Biol 9: 545–553. - PubMed
    1. Ernst JD (2012) The immunological life cycle of tuberculosis. Nat Rev Immunol 12: 581–591. - PubMed
    1. Hett EC, Rubin EJ (2008) Bacterial growth and cell division: a mycobacterial perspective. Microbiol Mol Biol Rev 72: 126–156. - PMC - PubMed
    1. Letek M, Fiuza M, Villadangos A, Mateos L, Gil J (2012) Cytoskeletal proteins of actinobacteria. International journal of cell biology 2012: 905832. - PMC - PubMed

Publication types

MeSH terms