

Electrical wave propagation in an anisotropic model of the left ventricle based on analytical description of cardiac architecture
- PMID: 24817308
- PMCID: PMC4015904
- DOI: 10.1371/journal.pone.0093617
Electrical wave propagation in an anisotropic model of the left ventricle based on analytical description of cardiac architecture
Erratum in
- PLoS One. 2014;9(6):e101611
Abstract
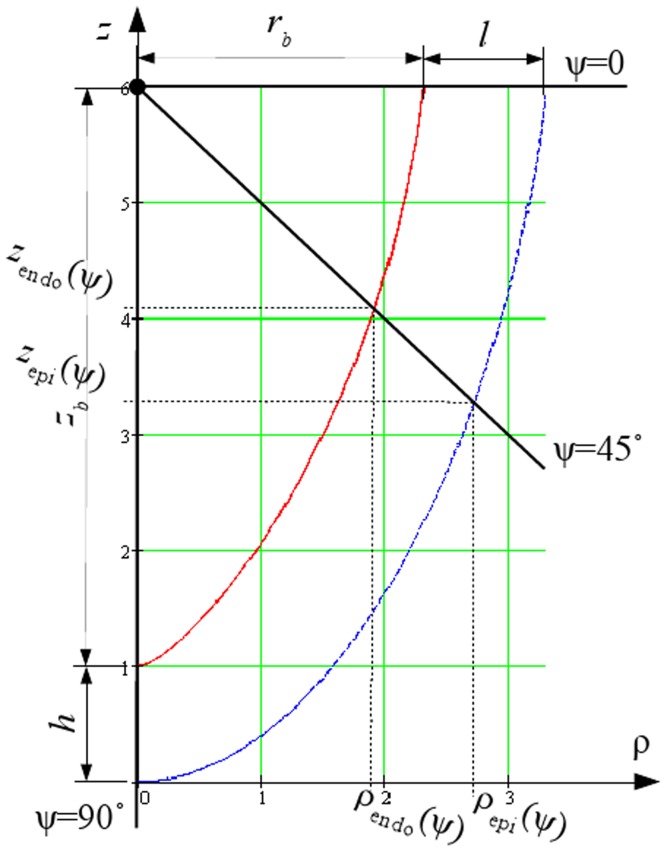
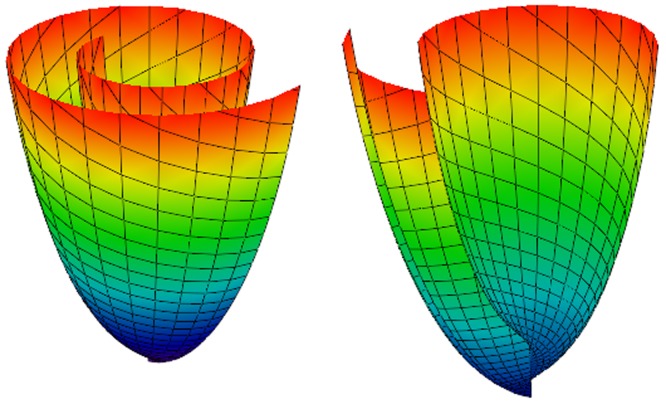
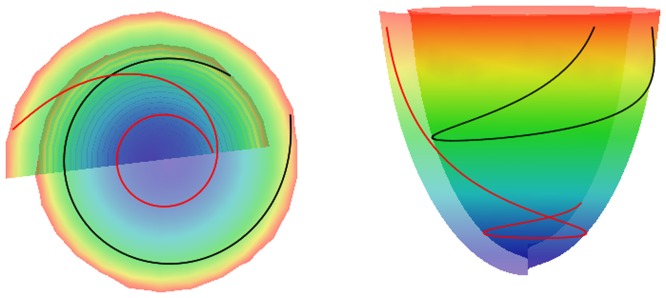
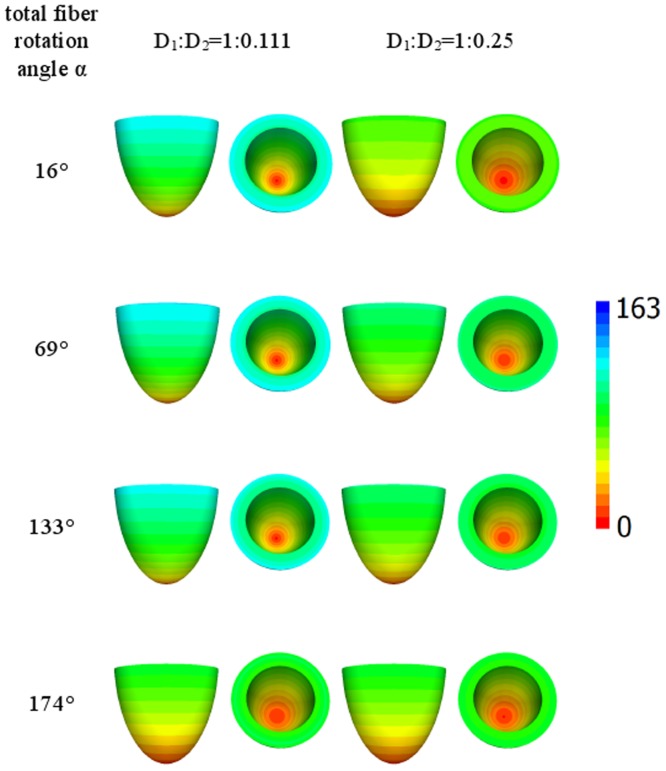
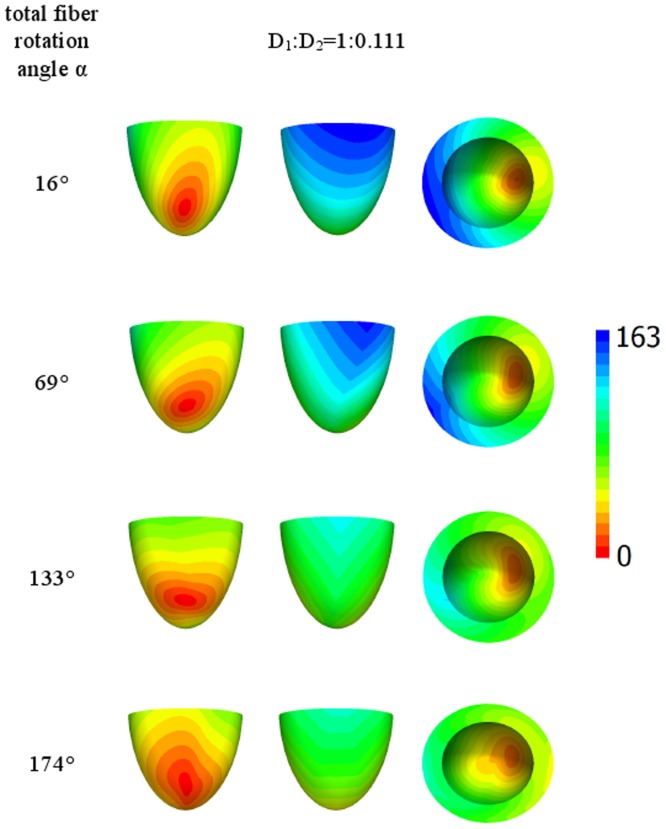
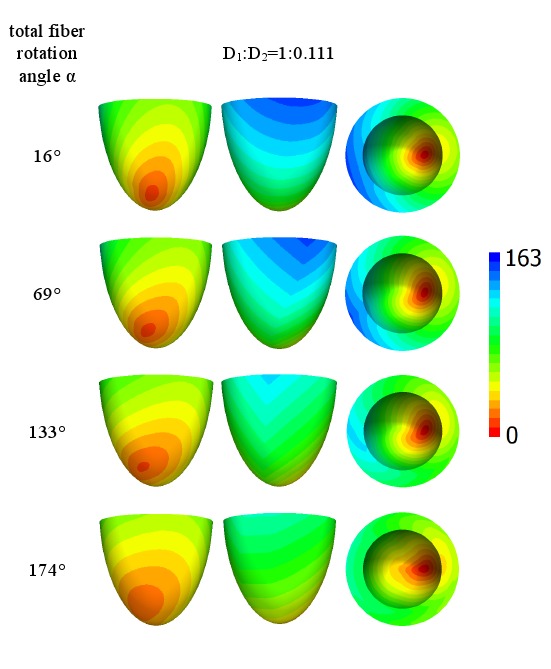
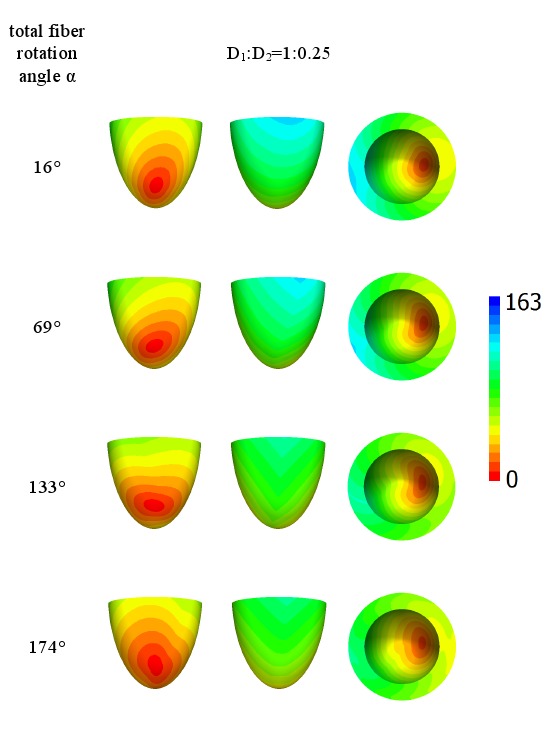
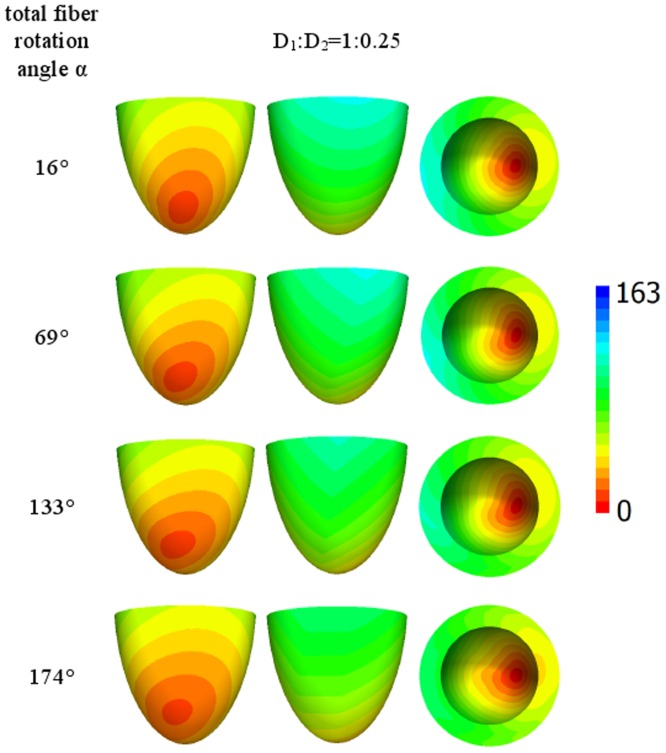
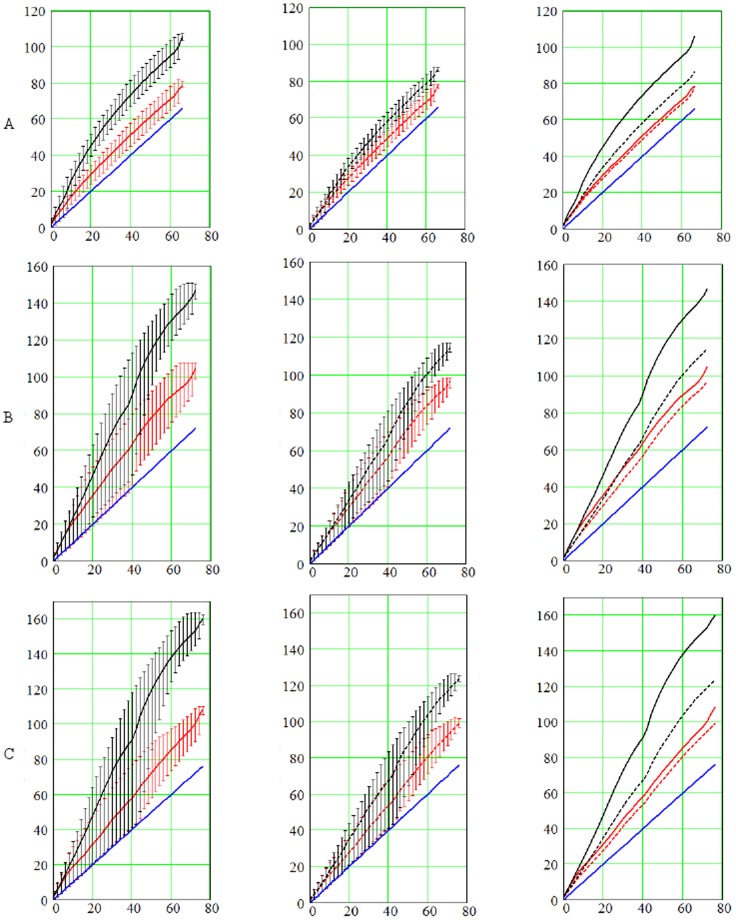
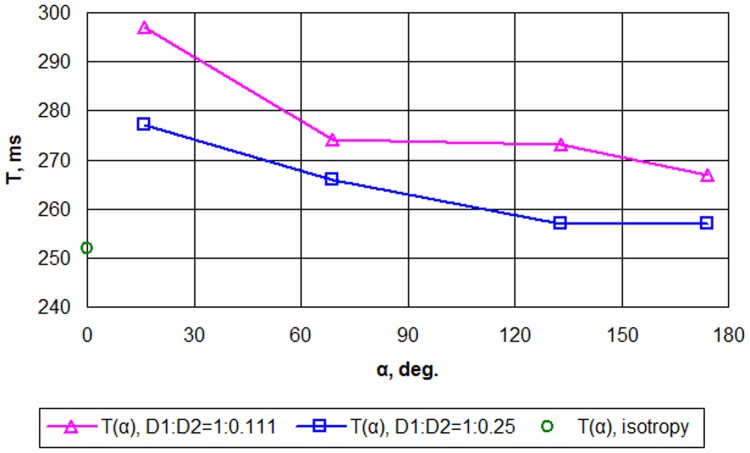
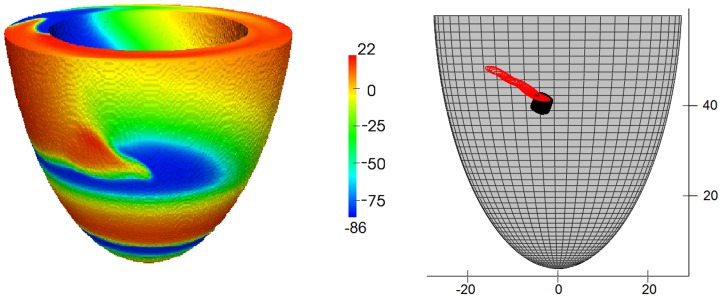
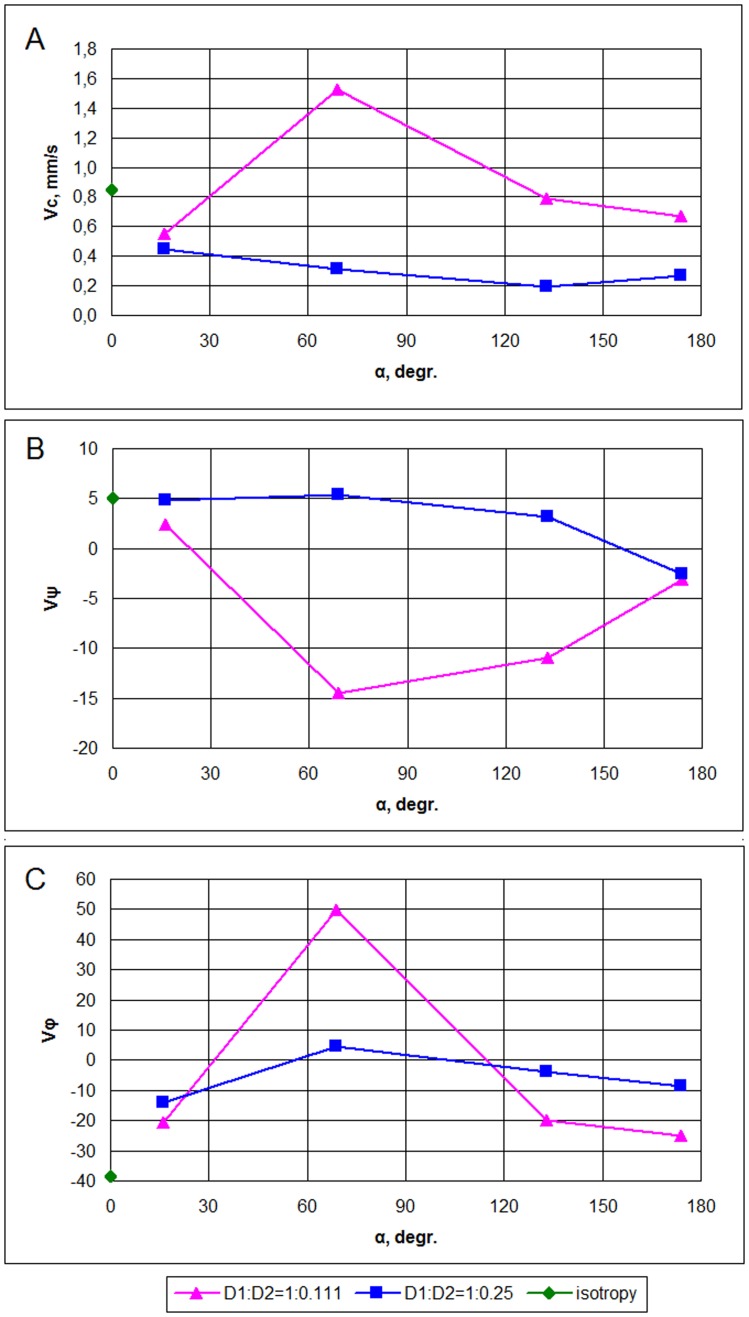
We develop a numerical approach based on our recent analytical model of fiber structure in the left ventricle of the human heart. A special curvilinear coordinate system is proposed to analytically include realistic ventricular shape and myofiber directions. With this anatomical model, electrophysiological simulations can be performed on a rectangular coordinate grid. We apply our method to study the effect of fiber rotation and electrical anisotropy of cardiac tissue (i.e., the ratio of the conductivity coefficients along and across the myocardial fibers) on wave propagation using the ten Tusscher-Panfilov (2006) ionic model for human ventricular cells. We show that fiber rotation increases the speed of cardiac activation and attenuates the effects of anisotropy. Our results show that the fiber rotation in the heart is an important factor underlying cardiac excitation. We also study scroll wave dynamics in our model and show the drift of a scroll wave filament whose velocity depends non-monotonically on the fiber rotation angle; the period of scroll wave rotation decreases with an increase of the fiber rotation angle; an increase in anisotropy may cause the breakup of a scroll wave, similar to the mother rotor mechanism of ventricular fibrillation.
Conflict of interest statement
Figures
Similar articles
-
[Numerical Simulation of Propagation of Electric Excitation in the Heart Wall Taking into Account Its Fibrous-Laminar Structure].Biofizika. 2015 Jul-Aug;60(4):748-57. Biofizika. 2015. PMID: 26394475 Russian.
-
Scroll-wave dynamics in human cardiac tissue: lessons from a mathematical model with inhomogeneities and fiber architecture.PLoS One. 2011 Apr 5;6(4):e18052. doi: 10.1371/journal.pone.0018052. PLoS One. 2011. PMID: 21483682 Free PMC article.
-
Scroll wave dynamics in a three-dimensional cardiac tissue model: roles of restitution, thickness, and fiber rotation.Biophys J. 2000 Jun;78(6):2761-75. doi: 10.1016/S0006-3495(00)76821-4. Biophys J. 2000. PMID: 10827961 Free PMC article.
-
Anatomical architecture and electrical activity of the heart.Acta Cardiol. 1997;52(2):91-105. Acta Cardiol. 1997. PMID: 9187417 Review.
-
Influence of anisotropic conduction properties in the propagation of the cardiac action potential.Prog Biophys Mol Biol. 2007 May-Jun;94(1-2):144-68. doi: 10.1016/j.pbiomolbio.2007.03.014. Epub 2007 Mar 24. Prog Biophys Mol Biol. 2007. PMID: 17482242 Free PMC article. Review.
Cited by
-
Algorithmic Generation of Parameterized Geometric Models of the Aortic Valve and Left Ventricle.Sensors (Basel). 2024 Dec 24;25(1):11. doi: 10.3390/s25010011. Sensors (Basel). 2024. PMID: 39796802 Free PMC article.
-
Drift of Scroll Wave Filaments in an Anisotropic Model of the Left Ventricle of the Human Heart.Biomed Res Int. 2015;2015:389830. doi: 10.1155/2015/389830. Epub 2015 Oct 11. Biomed Res Int. 2015. PMID: 26539486 Free PMC article.
-
Parameter variations in personalized electrophysiological models of human heart ventricles.PLoS One. 2021 Apr 28;16(4):e0249062. doi: 10.1371/journal.pone.0249062. eCollection 2021. PLoS One. 2021. PMID: 33909606 Free PMC article.
-
Conduction in the Heart Wall: Helicoidal Fibers Minimize Diffusion Bias.Sci Rep. 2018 May 8;8(1):7165. doi: 10.1038/s41598-018-25334-7. Sci Rep. 2018. PMID: 29739992 Free PMC article.
-
Gaussian Process Regressions for Inverse Problems and Parameter Searches in Models of Ventricular Mechanics.Front Physiol. 2018 Aug 14;9:1002. doi: 10.3389/fphys.2018.01002. eCollection 2018. Front Physiol. 2018. PMID: 30154725 Free PMC article.
References
-
- Myerburg R, Kessler K, Interian J (1990) Cardiac Electrophysiology: From Cell to Bedside, Philadelphia: Saunders, chapter Clinical and experimental pathophysiology of sudden cardiac death. 1st edition, pp. 666–678.
-
- Panfilov A, Holden A, editors (1997) Computational Biology of the Heart. Wiley, Chichester.
-
- Panfilov A, Keener J (1995) Re-entry in an anatomical model of the heart. Chaos, Solitons and Fractals 5: 681–689.
-
- Panfilov A (1999) Three-dimensional organization of electrical turbulence in the heart. Phys Rev E 59: R6251–R6254. - PubMed
Publication types
MeSH terms
LinkOut - more resources
Full Text Sources
Other Literature Sources
