

Bayesian inference of local trees along chromosomes by the sequential Markov coalescent
- PMID: 24817610
- PMCID: PMC4104301
- DOI: 10.1007/s00239-014-9620-5
Bayesian inference of local trees along chromosomes by the sequential Markov coalescent
Abstract
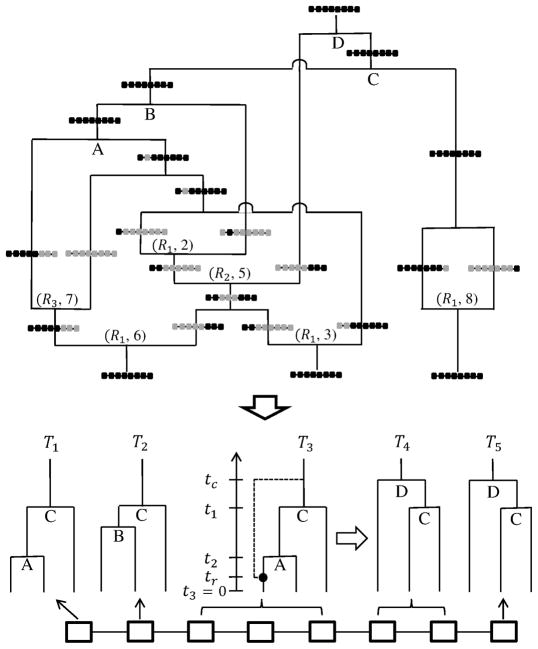
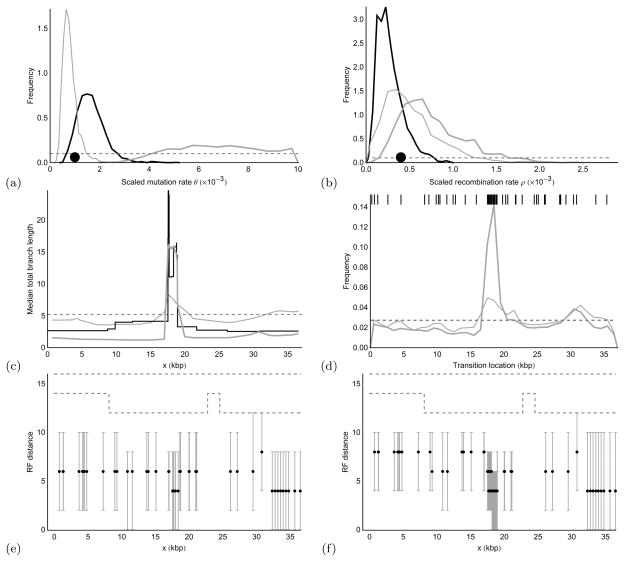
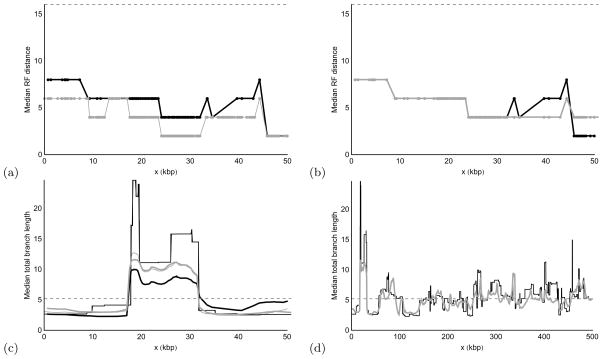
We propose a genealogy-sampling algorithm, Sequential Markov Ancestral Recombination Tree (SMARTree), that provides an approach to estimation from SNP haplotype data of the patterns of coancestry across a genome segment among a set of homologous chromosomes. To enable analysis across longer segments of genome, the sequence of coalescent trees is modeled via the modified sequential Markov coalescent (Marjoram and Wall, Genetics 7:16, 2006). To assess performance in estimating these local trees, our SMARTree implementation is tested on simulated data. Our base data set is of the SNPs in 10 DNA sequences over 50 kb. We examine the effects of longer sequences and of more sequences, and of a recombination and/or mutational hotspot. The model underlying SMARTree is an approximation to the full recombinant-coalescent distribution. However, in a small trial on simulated data, recovery of local trees was similar to that of LAMARC (Kuhner et al. Genetics 156:1393-1401, 2000a), a sampler which uses the full model.
Figures
Similar articles
-
The Bacterial Sequential Markov Coalescent.Genetics. 2017 May;206(1):333-343. doi: 10.1534/genetics.116.198796. Epub 2017 Mar 3. Genetics. 2017. PMID: 28258183 Free PMC article.
-
Joint inference of identity by descent along multiple chromosomes from population samples.J Comput Biol. 2014 Mar;21(3):185-200. doi: 10.1089/cmb.2013.0140. J Comput Biol. 2014. PMID: 24606562 Free PMC article.
-
LAMARC 2.0: maximum likelihood and Bayesian estimation of population parameters.Bioinformatics. 2006 Mar 15;22(6):768-70. doi: 10.1093/bioinformatics/btk051. Epub 2006 Jan 12. Bioinformatics. 2006. PMID: 16410317
-
Estimating variable effective population sizes from multiple genomes: a sequentially markov conditional sampling distribution approach.Genetics. 2013 Jul;194(3):647-62. doi: 10.1534/genetics.112.149096. Epub 2013 Apr 22. Genetics. 2013. PMID: 23608192 Free PMC article.
-
Phase-type distributions in mathematical population genetics: An emerging framework.Theor Popul Biol. 2024 Jun;157:14-32. doi: 10.1016/j.tpb.2024.03.001. Epub 2024 Mar 7. Theor Popul Biol. 2024. PMID: 38460602 Review.
Cited by
-
Resolving Evolutionary Relationships in Closely Related Species with Whole-Genome Sequencing Data.Syst Biol. 2015 Nov;64(6):1000-17. doi: 10.1093/sysbio/syv045. Epub 2015 Jul 17. Syst Biol. 2015. PMID: 26187295 Free PMC article.
-
A renewal theory approach to IBD sharing.Theor Popul Biol. 2014 Nov;97:35-48. doi: 10.1016/j.tpb.2014.08.002. Epub 2014 Aug 18. Theor Popul Biol. 2014. PMID: 25149691 Free PMC article.
-
Assessing Differences Between Ancestral Recombination Graphs.J Mol Evol. 2015 Jun;80(5-6):258-64. doi: 10.1007/s00239-015-9676-x. Epub 2015 Apr 5. J Mol Evol. 2015. PMID: 25841763
-
Inferring Past Effective Population Size from Distributions of Coalescent Times.Genetics. 2016 Nov;204(3):1191-1206. doi: 10.1534/genetics.115.185058. Epub 2016 Sep 16. Genetics. 2016. PMID: 27638421 Free PMC article.
-
The SMC' is a highly accurate approximation to the ancestral recombination graph.Genetics. 2015 May;200(1):343-55. doi: 10.1534/genetics.114.173898. Epub 2015 Mar 17. Genetics. 2015. PMID: 25786855 Free PMC article.
References
-
- Felsenstein J. Evolutionary trees from DNA-sequences - a maximum-likelihood approach. Journal of Molecular Evolution. 1981;17:368–376. - PubMed
-
- Felsenstein J. Inferring Phylogenies. Sinauer Associates; Sunderland, MA: 2004.
Publication types
MeSH terms
Grants and funding
LinkOut - more resources
Full Text Sources
Other Literature Sources
