MRI Investigation of the Linkage Between Respiratory Motion of the Heart and Markers on Patient's Abdomen and Chest: Implications for Respiratory Amplitude Binning List-Mode PET and SPECT Studies
- PMID: 24817767
- PMCID: PMC4013094
- DOI: 10.1109/TNS.2013.2294829
MRI Investigation of the Linkage Between Respiratory Motion of the Heart and Markers on Patient's Abdomen and Chest: Implications for Respiratory Amplitude Binning List-Mode PET and SPECT Studies
Abstract
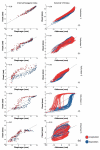
Respiratory motion of the heart impacts the diagnostic accuracy of myocardial-perfusion emission-imaging studies. Amplitude binning has come to be the method of choice for binning list-mode based acquisitions for correction of respiratory motion in PET and SPECT. In some subjects respiratory motion exhibits hysteretic behavior similar to damped non-linear cyclic systems. The detection and correction of hysteresis between the signals from surface movement of the patient's body used in binning and the motion of the heart within the chest remains an open area for investigation. This study reports our investigation in nine volunteers of the combined MRI tracking of the internal respiratory motion of the heart using Navigators with stereo-tracking of markers on the volunteer's chest and abdomen by a visual-tracking system (VTS). The respiratory motion signals from the internal organs and the external markers were evaluated for hysteretic behavior analyzing the temporal correspondence of the signals. In general, a strong, positive correlation between the external marker motion (AP direction) and the internal heart motion (SI direction) during respiration was observed. The average ± standard deviation in the Spearman's ranked correlation coefficient (ρ) over the nine volunteer studied was 0.92 ± 0.1 between the external abdomen marker and the internal heart, and 0.87 ± 0.2 between the external chest marker and the internal heart. However despite the good correlation on average for the nine volunteers, in three studies a poor correlation was observed due to hysteretic behavior between inspiration and expiration for either the chest marker and the internal motion of the heart, or the abdominal marker and the motion of the heart. In all cases we observed a good correlation of at least either the abdomen or the chest with the heart. Based on this result, we propose the use of marker motion from both the chest and abdomen regions when estimating the internal heart motion to detect and address hysteresis when binning list-mode emission data.
Keywords: Cardiac respiratory motion; MRI; emission tomography; hysteresis; signal processing.
Figures


Similar articles
-
Correction of hysteretic respiratory motion in SPECT myocardial perfusion imaging: Simulation and patient studies.Med Phys. 2017 Feb;44(2):437-450. doi: 10.1002/mp.12072. Med Phys. 2017. PMID: 28032913 Free PMC article.
-
Adaptation of the modified Bouc-Wen model to compensate for hysteresis in respiratory motion for the list-mode binning of cardiac SPECT and PET acquisitions: testing using MRI.Med Phys. 2014 Nov;41(11):112508. doi: 10.1118/1.4895845. Med Phys. 2014. PMID: 25370667 Free PMC article.
-
A flexible multicamera visual-tracking system for detecting and correcting motion-induced artifacts in cardiac SPECT slices.Med Phys. 2009 May;36(5):1913-23. doi: 10.1118/1.3117592. Med Phys. 2009. PMID: 19544811 Free PMC article.
-
Motion Management in PET/CT: Technological Solutions.Curr Radiopharm. 2018;11(2):79-85. doi: 10.2174/1874471011666180419150440. Curr Radiopharm. 2018. PMID: 29676240 Review.
-
Management of respiratory motion in PET/computed tomography: the state of the art.Nucl Med Commun. 2014 Feb;35(2):113-22. doi: 10.1097/MNM.0000000000000048. Nucl Med Commun. 2014. PMID: 24352107 Free PMC article. Review.
Cited by
-
Ultrasound-based sensors to monitor physiological motion.Med Phys. 2021 Jul;48(7):3614-3622. doi: 10.1002/mp.14949. Epub 2021 Jun 7. Med Phys. 2021. PMID: 33999423 Free PMC article.
-
Use of MRI to assess the prediction of heart motion with gross body motion in myocardial perfusion imaging by stereotracking of markers on the body surface.Med Phys. 2013 Nov;40(11):112504. doi: 10.1118/1.4824693. Med Phys. 2013. PMID: 24320463 Free PMC article.
-
Correction of hysteretic respiratory motion in SPECT myocardial perfusion imaging: Simulation and patient studies.Med Phys. 2017 Feb;44(2):437-450. doi: 10.1002/mp.12072. Med Phys. 2017. PMID: 28032913 Free PMC article.
-
Ultrasound-based sensors for respiratory motion assessment in multimodality PET imaging.Phys Med Biol. 2022 Jan 19;67(2):10.1088/1361-6560/ac4213. doi: 10.1088/1361-6560/ac4213. Phys Med Biol. 2022. PMID: 34891142 Free PMC article.
-
Clinical evaluation of three respiratory gating schemes for different respiratory patterns on cardiac SPECT.Med Phys. 2020 Sep;47(9):4223-4232. doi: 10.1002/mp.14354. Epub 2020 Jul 18. Med Phys. 2020. PMID: 32583468 Free PMC article.
References
-
- Dilsizian V, Bacharach S, Beanlands R, Bergmann S, Delbeke D, Gropler R, et al. PET myocardial perfusion and metabolism clinical imaging. J. Nucl. Cardiol. 2009;16:651–51.
-
- Holly TA, Abbott BG, Al-Mallah M, Calnon DA, Cohen MC, DiFilippo FP, et al. Single photon-emission computed tomography. J. Nucl. Cardiol. 2010;17:941–73. - PubMed
-
- Cho K, Kumiata S, Okada S, Kumazaki T. Development of respiratory gated myocardial SPECT system. J. Nucl. Cardiol. 1999;6:20–28. - PubMed
-
- Abdelnour AF, Nehmeh SA, Pan T, Humm JL, Vernon P, Schoder H, et al. Phase and amplitude binning for 4D-CT imaging. Phys. Med. Biol. 2007;52:3515–29. - PubMed
Grants and funding
LinkOut - more resources
Full Text Sources
Other Literature Sources
