. 1994;7(3):225-242.

Effect of Tissue-Culture Substratum and Extracellular Matrix Overlay on Liver-Selective and Xenobiotic Inducible Gene Expression in Primary Rat Hepatocytes

Affiliations

Effect of Tissue-Culture Substratum and Extracellular Matrix Overlay on Liver-Selective and Xenobiotic Inducible Gene Expression in Primary Rat Hepatocytes

J S Sidhu et al. In Vitro Toxicol. 1994.

Abstract

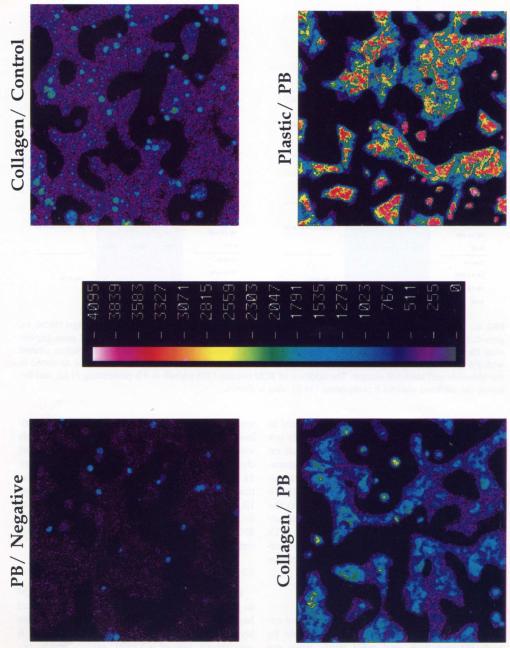
In a previous study (Sidhu et al., 1993), we demonstrated that a combination of certain cell culture media, hormone addition, and extracellular matrix (ECM) overlay coordinately modulated the expression of certain liver-selective genes in primary rat hepatocyte cultures, including the responsiveness of genes to phenobarbital. However, little is known about the interactions between the type of substratum upon which hepatocytes are adhered and the ECM overlay, as codeterminants of liver-selective gene expression. The present study was undertaken to compare specific substrata, including tissue culture-grade plastic, Primaria, and type 1 collagen-coated plastic, in combination with the presence or absence of standard ECM or a growth-factor-reduced ECM overlay. Hepatocyte cultures were assessed either as control cultures or subsequent to treatment for 24 h with phenobarbital (0.1 or 1 mM), or beta-naphthoflavone (22 μM), to monitor responses of hepatocytes to two prototypic gene-inducing agents. Analyses of maintenance and induction of cytochrome P450 and liver-selective gene expression included measures of mRNA levels using Northern blot and slot-blot hybridization and single cell immunofluorescence assays to measure levels of specific cytochrome P450 proteins. The results of these experiments demonstrated that hepatocyte-selective expression, including the absolute level of induction response (relative to those observed in the rat liver in vivo) was highly dependent on the presence of ECM overlay but independent of the substratum employed. As studied herein, the establishment of optimal conditions for primary hepatocyte culture, enabling reproduction of responses observed in vivo, is important to further prospects for in vitro toxicity testing and for investigating molecular mechanisms of phenobarbital-mediated gene regulation.


Figures

FIG. 1
FIG. 1
Morphologic comparison of hepatocytes cultured on a collagen type 1 substratum with and without an overlay of ECM. Comparison of standard Matrigel (ECM) vs growth-factor-reduced Matrigel (defined ECM). A–C 24 h postisolation: no ECM (A); ECM (B); defined ECM (C). D–F 96 h postisolation: no ECM (D); ECM (E); defined ECM (F). Representative micrographs shown for collagen substratum. Similar results were observed for plastic and Primaria (not shown).
FIG. 2
FIG. 2
Northern blot analysis of the effects of ECM overlay (ECM vs. defined ECM) on PB-inducibility (1.00 mM) of CYP2B1, 2B2, 3A1 gene expression in primary rat hepatocytes. Total RNA was extracted and 5 μg resolved, as stated in Materials and Methods section. External controls (5 μg) are indicated by phenobarbital (PB)- and dexamethasone (Dex)-induced Sprague-Dawley (S.D.) liver. In addition microsomal epoxide hydrolase (mEH) and albumin mRNA expression levels are also represented. Ribosomal 18S hybridization indicates a lower than expected loading in the lane designated PB (no ECM overlay). However, the data still represent a significant difference between the expression of PB-inducible CYP genes in the presence or absence of an ECM overlay (see legend to Fig. 3).
FIG. 3
FIG. 3
Slot-blot comparison of substrata together with the absence (No ECM) or presence of standard Matrigel (ECM) vs. growth-factor-reduced matrigel (defined ECM) overlay on PB-inducibility of CYP2B1 gene expression. Hepatocytes were plated on collagen type 1, plastic or Primaria substrata and 48 h postisolation, treated with PB (0.1/1.00 mM) or BNF (22 μM) for 24 h. Total RNA was evaluated by slot-blot analysis, as stated in Materials and Methods section. The addition of ECM overlay (233 μg/ml) at 4 h postplating (4 h), and delaying the addition until 24 h postplating (24 h), also is shown.
FIG. 4
FIG. 4
Densitometric evaluation of slot-blot data shown in Figure 3 for CYP2B1 gene expression. The addition of ECM overlay (233 μg/ml) at 4 h postplating (4 h), and delaying the addition until 24 h postplating (24 h), also is shown. Autoradiographic data were quantified by whole-band analysis and normalized to equivalent 18S ribosomal rRNA data. Normalized signal values are represented by arbitrary O.D. units.
FIG. 5
FIG. 5
Slot-blot comparison of substrata and absence (no ECM) or presence of standard Matrigel (ECM) vs. growth-factor-reduced Matrigel (defined ECM) overlay on PB-inducibility of CYP3A1 gene expression. Hepatocytes were plated on collagen type 1, plastic or Primaria substrata and 48 h postisolation, treated with PB (0.1/1.00 mM) or BNF (22 μM) for 24 h. Total RNA was evaluated by slot-blot analysis, as stated in Materials and Methods section. The addition of ECM overlay (233 μg/ml) at 4 h postplating (4 h), and delaying the addition till 24 h postplating (24 h), also is shown.
FIG. 6
FIG. 6
Densitometric evaluation of slot-blot data shown in Figure 5 for CYP3A1 gene expression. The addition of ECM overlay (233 μg/ml) at 4 h postplating (4 h), and delaying the addition till 24 h postplating (24 h), also is shown. Autoradiographic data were quantified by whole-band analysis and normalized to equivalent 18S ribosomal rRNA data. Normalized signal values are represented by arbitrary optical density units.
FIG. 7
FIG. 7
Effect of substratum on level of immunoreactive CYP2B1/2B2 protein in primary rat hepatocytes cultured with an overlay of ECM. Hepatocytes were plated either on tissue-culture treated plastic or type 1 collagen-coateci plastic, an overlay of ECM was applied at 24 h postplating and cells were subsequently induced with PB (0.1 mM). Cells were fixed and penneabilized, as stated in Materials and Methods section, then exposed to a rabbit polyclonal antibody specific for CYP2B1/2B2 followed by a Fluorescein Isothiocyanate conjugated goat antirabbit IgG. Confocal microscopy in combination with scanning laser cytometry was used to detect single cell-associated immunofluorescence due to PB-induced CYP2B1/2B2 protein. Multiple fields (360 × 360 μm) were examined and representative fluorescence micrographs are shown as follows: (PB/Negative), cells cultured on a collagen substratum, treated with PB but no primary antibody; (Collagen/Control), cells cultured on a collagen substratum, not induced with PB; (Collagen/PB), cells cultured on a collagen substratum, and induced with PB; (Plastic/PB), cells cultured on a plastic substratum, and induced with PB. The pseudocolor bar in the center of the figure represents a linear graduation of relative fluorescence intensity units.
FIG. 8
FIG. 8
Slot-blot comparison of substrata and absence (no ECM) or presence of standard Matrigel (ECM) vs. growth-factor reduced Matrigel (defined ECM) overlay on βNF-inducibility of CYP1A1 and 1A2 gene expression. Hepatocytes were plated on collagen type 1, plastic or Primaria substrata and 48 h postisolation, treated with PB (0.1/1.00 mM) or βNF (22 μM) for 24 h. Total RNA was evaluated by slot-blot analysis, as stated in the Materials and Methods section. The addition of ECM overlay (233 μg/ml) at 4 h postplating (4 h), and delaying the addition until 24 h postplating (24 h), also is shown.
FIG. 9
FIG. 9
Slot-blot comparison of substrata together with the absence (no ECM) or presence of standard Matrigel (ECM) vs. growth-factor-reduced Matrigel (defined ECM) overlay on liver-specific albumin and tissue-specific transferrin gene expression. Total RNA was evaluated by slot-blot analysis, as stated in the Materials and Methods section. The effects of adding the ECM overlay (233 μg/ml) at 4 h postplating (4 h), and upon delaying ECM additions until 24 h postplating (24 h), also are shown.
FIG. 10
FIG. 10
Slot-blot comparison of substrata and absence (no ECM) or presence of standard Matrigel (ECM) vs. growth factor-reduced Matrigel (defined ECM) overlay on microsomal epoxide hydrolase (mEH) gene expression. Total RNA was evaluated by slot-blot analysis, as stated in the Materials and Methods section. The effects of adding the ECM overlay (233 μg/ml) at 4 h postplating (4 h), or after delaying the addition until 24 h postplating (24 h), also are shown. In addition the ribosomal 18S hybridization signal is included and was used to normalize relative gene expression levels.
FIG. 11
FIG. 11
Northern blot analysis of the effects of ECM overlay and substratum on albumin, mEH, CYP2E1, C/EBPα, GST Ya1, and GST Pi expression. Hepatocytes were cultured on collagen type 1, plastic, or Primaria substrata in the presence or absence of ECM overlay for 96 h. Total RNA was isolated at the indicated time points and 10 μg resolved, as stated in the Materials and Methods section. The lanes represent the following treatments: lane 1, freshly isolated hepatocytes; lane 2, 4 h postisolation, plastic substratum; lane 3, 4 h postisolation, Primaria substratum; lane 4, 4 h postisolation, collagen type 1 substratum; lane 5, 24 h postisolation, plastic without ECM overlay; lane 6, 24 h, plastic plus ECM overlay; lane 7, 48 h postisolation, plastic without ECM overlay; lane 8, 48 h postisolation, plastic plus ECM overlay; lane 9, 72 h postisolation, plastic without ECM overlay; lane 10, 72 h postisolation, plastic plus ECM overlay; lane 11, 96 h postisolation, plastic plus ECM overlay; lane 12, 96 h postisolation, Primaria plus ECM overlay; lane 13, 96 h postisolation, collagen type 1 plus ECM overlay; lane 14, 5 μg PB-induced Sprague-Dawley rat liver RNA (S.D.). The membrane was hybridized with 32P-labeled gene-specific cDNA and oligonucleotide probes, as stated in the Materials and Methods section. The arrows on the left hand side of the figure indicate the position of the 18S rRNA marker. Note that the GST Ya1 hybridization probe cross-hybridized to some extent with 18S rRNA.

Similar articles

Cited by

References

    1. ABRAMOVITZ M, ISHIGAKI S, LISTOWSKY I. Differential regulation of glutathione-S-transferases in cultured hepatocytes. Hepatology. 1989;9:233–239. - PubMed
    1. ADESNIK M, ATCHISON M. Genes for cytochrome P-450 and their regulation. Crit. Rev. Biochem. 1985;19:247–305. - PubMed
    1. AOKI Y, MATSUMOTO M, SUZUKI KT. Expression of glutathione-S-transferase P-form in primary cultured rat liver parenchymal cells by coplanar polychlorinated biphenyl congeners is suppressed by protein kinase inhibitors and dexamethasone. FEBS Letts. 1993;333:114–118. - PubMed
    1. BEN-ZE’EV A, ROBINSON GS, BUCHER NLR, FARMER ST. Cell–cell and cell–matrix interactions differentially regulate the expression of hepatic and cytoskeletal genes in primary cultures of rat hepatocytes. Proc. Natl. Acad. Sci. USA. 1988;85:2161–2165. - PMC - PubMed
    1. BISSELL DM, GUZELIAN PS. Phenotypic stability of adult rat hepatocytes in primary monolayer culture. Ann. NY Acad. Sci. 1980;349:85–98. - PubMed

LinkOut - more resources