. 2014 May 1:5:345.
doi: 10.3389/fpsyg.2014.00345. eCollection 2014.

Observer efficiency in free-localization tasks with correlated noise

Affiliations

Observer efficiency in free-localization tasks with correlated noise

Craig K Abbey et al. Front Psychol. .

Abstract

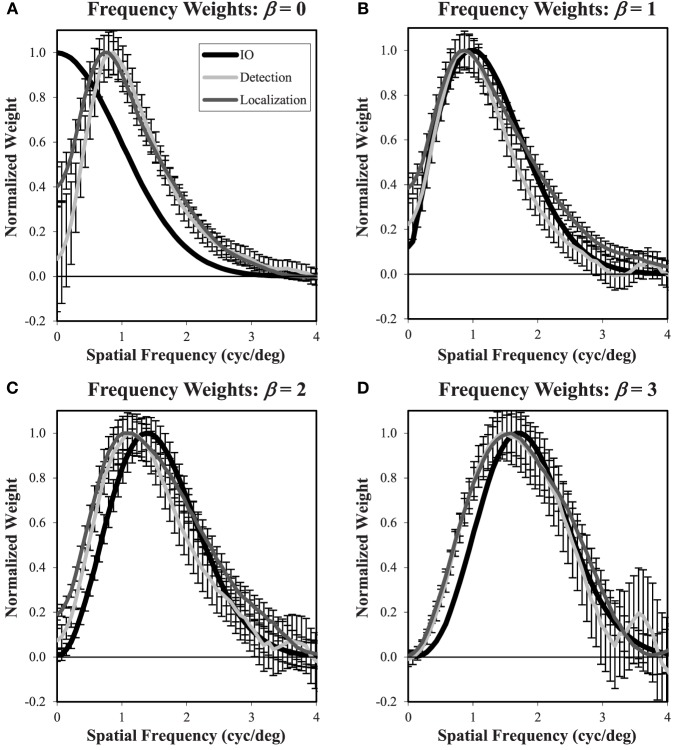
The efficiency of visual tasks involving localization has traditionally been evaluated using forced choice experiments that capitalize on independence across locations to simplify the performance of the ideal observer. However, developments in ideal observer analysis have shown how an ideal observer can be defined for free-localization tasks, where a target can appear anywhere in a defined search region and subjects respond by localizing the target. Since these tasks are representative of many real-world search tasks, it is of interest to evaluate the efficiency of observer performance in them. The central question of this work is whether humans are able to effectively use the information in a free-localization task relative to a similar task where target location is fixed. We use a yes-no detection task at a cued location as the reference for this comparison. Each of the tasks is evaluated using a Gaussian target profile embedded in four different Gaussian noise backgrounds having power-law noise power spectra with exponents ranging from 0 to 3. The free localization task had a square 6.7° search region. We report on two follow-up studies investigating efficiency in a detect-and-localize task, and the effect of processing the white-noise backgrounds. In the fixed-location detection task, we find average observer efficiency ranges from 35 to 59% for the different noise backgrounds. Observer efficiency improves dramatically in the tasks involving localization, ranging from 63 to 82% in the forced localization tasks and from 78 to 92% in the detect-and- localize tasks. Performance in white noise, the lowest efficiency condition, was improved by filtering to give them a power-law exponent of 2. Classification images, used to examine spatial frequency weights for the tasks, show better tuning to ideal weights in the free-localization tasks. The high absolute levels of efficiency suggest that observers are well-adapted to free-localization tasks.

Keywords: free-localization tasks; ideal observer theory; image statistics; observer efficiency; power-law noise.


Figures

Figure 1
Figure 1
Detection and localization stimuli. Image displays for the detection (A) and localization (B) tasks. The target to be detected is a Gaussian (“bump”) profile(C) embedded in power-law noise with an exponent of 2 here. For the detection task, the target is located at the center of the cross when it is present. In the localization task, the target can be located anywhere within the search area indicated by the marks (arrow).
Figure 2
Figure 2
Sample power-law textures. Noisy backgrounds with different power-law exponents (β) are shown from the same underlying random number seed.
Figure 3
Figure 3
Processing white noise images. Processing white noise images (A) with the appropriate filter gives them a β = 2 power-law background (B). This transformation also changes the target profile, giving it much longer tails (C). Target contrast (arrows) is enhanced here for display.
Figure 4
Figure 4
Ideal observer LUT. The plots show performance of the ideal observer as a function of target contrast for each of the power-law exponents. These data can be used as a look-up-table for determining the threshold contrast needed by the IO to achieve a given level of performance. For example, at β = 1, the threshold contrast needed to achieve 80% correct is seen to be 0.4.
Figure 5
Figure 5
Classification images in free-localization tasks. Ideal observer filter weights (A) were used to generate responses for each power-law exponent. The filter weights were then estimated from the incorrectly localized noise fields (B). While there is some evidence of bias, particularly for β = 0 at low spatial frequencies, the estimated weights generally give a good sense of the actual filters used to perform the task.
Figure 6
Figure 6
Psychometric functions and thresholds. An example of detection and forced-localization psychometric data (A) and fitted psychometric functions are shown for one subject in one condition. Error bars = ±1 s.e. The fitting function is a cumulative Gaussian distribution that is used to determine the contrast threshold for 80% correct performance in the subsequent experiments. The average subject contrast thresholds (B) in each power-law background is shown for both detection and localization tasks. Standard errors across subjects (not shown) are less than 0.01. The localization tasks requires approximately a factor of 2 greater contrast to obtain equivalent (80% correct) performance.
Figure 7
Figure 7
Accuracy and reaction time. A check of performance levels in the efficiency data (A) shows that performance levels were reasonably close to the targeted 80% level. The midpoint of reaction time in each quartile (B) is plotted against performance for the quartile. Averages and standard errors across subjects are shown.
Figure 8
Figure 8
Task efficiency. Efficiency of detection and localization tasks is plotted as a function of the power-law exponent, showing a substantial increase for localization tasks. Error bars are ±1 s.e.
Figure 9
Figure 9
Detect and localize efficiency. The plot shows detect-and-localize efficiency compared to detection efficiency and localization efficiency for each power-law background. Error bars are ±1 s.e. Small differences with Figure 8 (detection efficiency and localization efficiency) are due to limiting the averages to the three subjects that participated in the D&L study.
Figure 10
Figure 10
Effect of processing the β = 0 condition. Efficiency of detection and localization tasks in β = 0 condition is plotted against efficiency with (processed) and without (unprocessed) filtering the images to have power-law spectrum with β = 2. Error bars represent ±1 s.e. Small difference between the unprocessed data and Figures 8, 9 are due to limiting the averages to the three subjects that participated in the processing study.
Figure 11
Figure 11
Classification images. Estimated classification images (cropped to 2.1° per side) are shown for each condition (columns) and subject (rows) in the detection (A) and localization (B) tasks. The images are windowed to have approximately the same magnitude of estimation error.
Figure 12
Figure 12
Frequency weights derived from Classification images. Radial frequency profiles are shown for each of the four power-law textures (A–D) with normalization so that the maximum weight is one. The ideal observer profile is derived from theory. The detection and localization plots are averaged across the five subjects. Error bars are ±1 s.e. averaged across subjects. The legend (A) applies to all plots.
Figure 13
Figure 13
Frequency weights for processed and unprocessed images. These plots are similar to Figure 12 and show estimated weights from the β = 0 images using the responses to processed and unprocessed images. In both the detection (A) and localization (B) tasks, the effect of image processing is to increase the estimated weights at low spatial frequency, bringing them closer to the ideal observer weights. The legend (A) applies to both plots.

References

    1. Abbey C. K., Eckstein M. P. (2007). Classification images for simple detection and discrimination tasks in correlated noise. J. Opt. Soc. Am. A Opt. Image Sci. Vis. 24, B110–B124 10.1364/JOSAA.24.00B110 - DOI - PubMed
    1. Abbey C. K., Zemp R. J., Liu J., Lindfors K. K., Insana M. F. (2006). Observer efficiency in discrimination tasks simulating malignant and benign breast lesions imaged with ultrasound. IEEE Trans. Med. Imaging. 25, 198–209 10.1109/TMI.2005.862205 - DOI - PMC - PubMed
    1. Ahumada A. J., Jr. (2002). Classification image weights and internal noise level estimation. J. Vis. 2, 121–131 10.1167/2.1.8 - DOI - PubMed
    1. Barlow H. (1977). Retinal and central factors in human vision limited by noise. Vertebrate Photoreception 337, C358
    1. Barlow H. B. (1978). The efficiency of detecting changes of density in random dot patterns. Vision Res. 18, 637–650 10.1016/0042-6989(78)90143-8 - DOI - PubMed

LinkOut - more resources