Review
. 2014 Jun;79(2):vii, 1-103.
doi: 10.1002/mono.12096.

The emergent executive: a dynamic field theory of the development of executive function

Review

The emergent executive: a dynamic field theory of the development of executive function

Aaron T Buss et al. Monogr Soc Res Child Dev. 2014 Jun.

Abstract

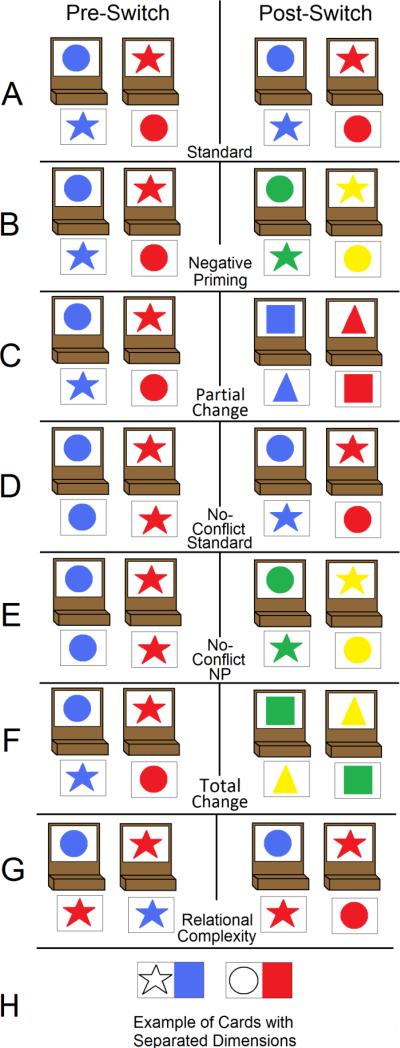
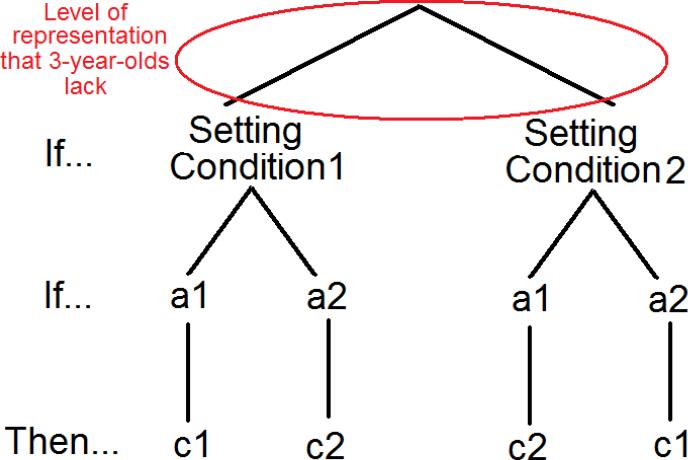
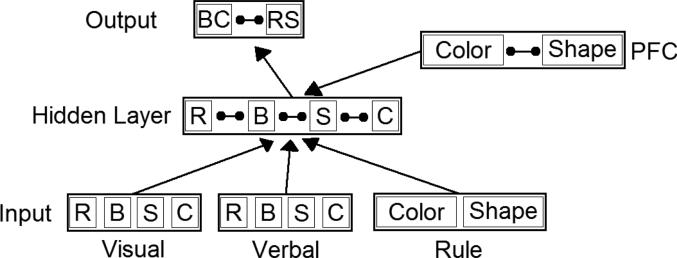
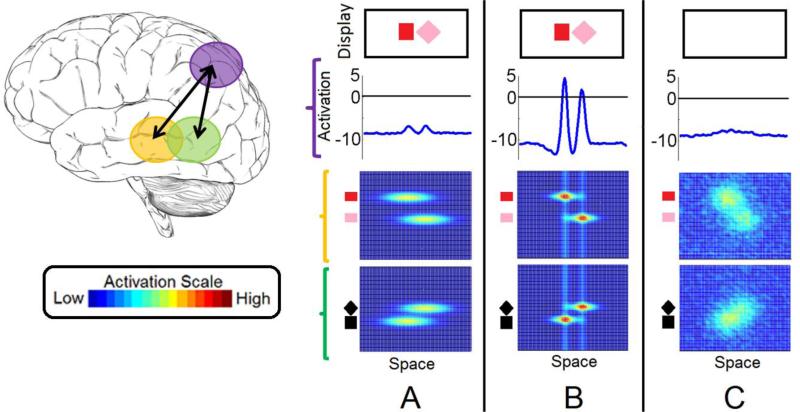
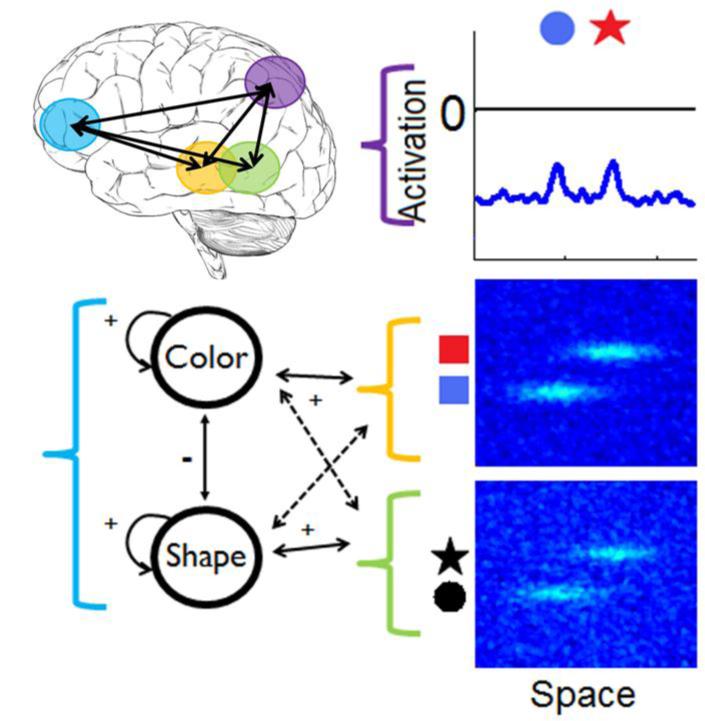
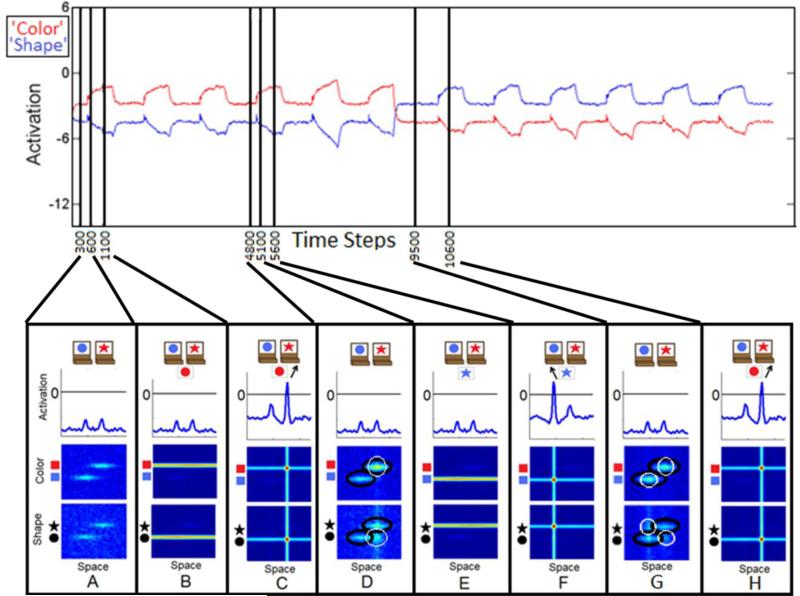
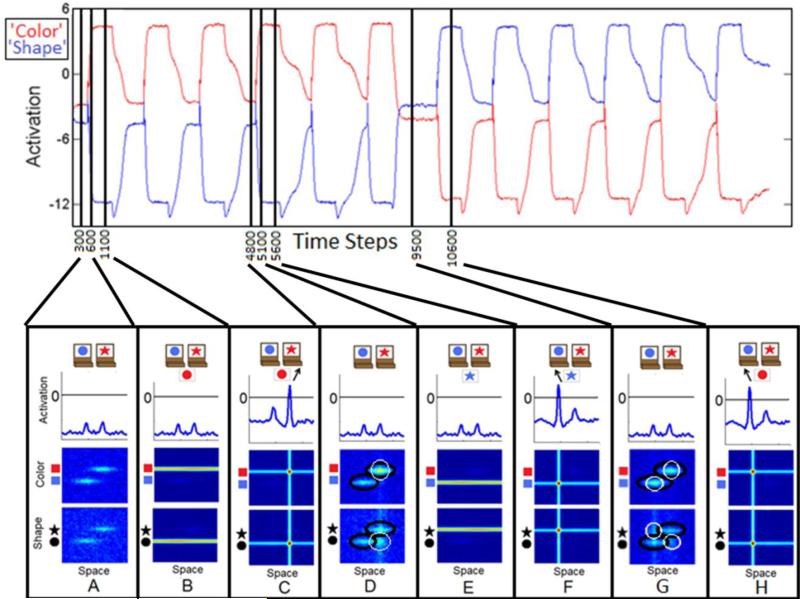
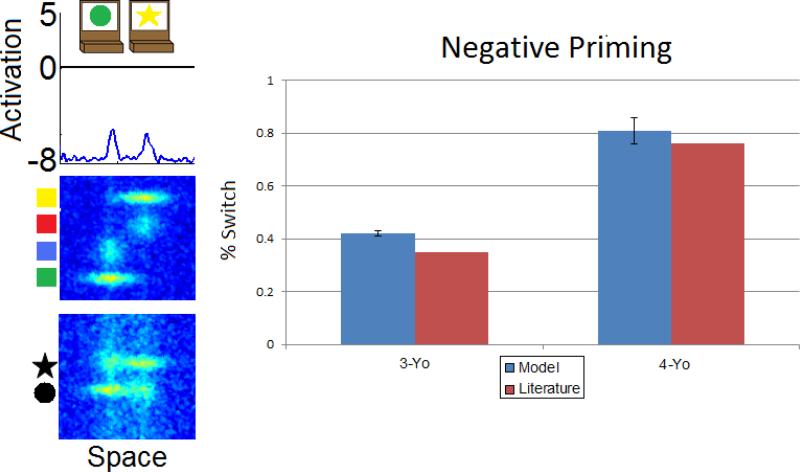
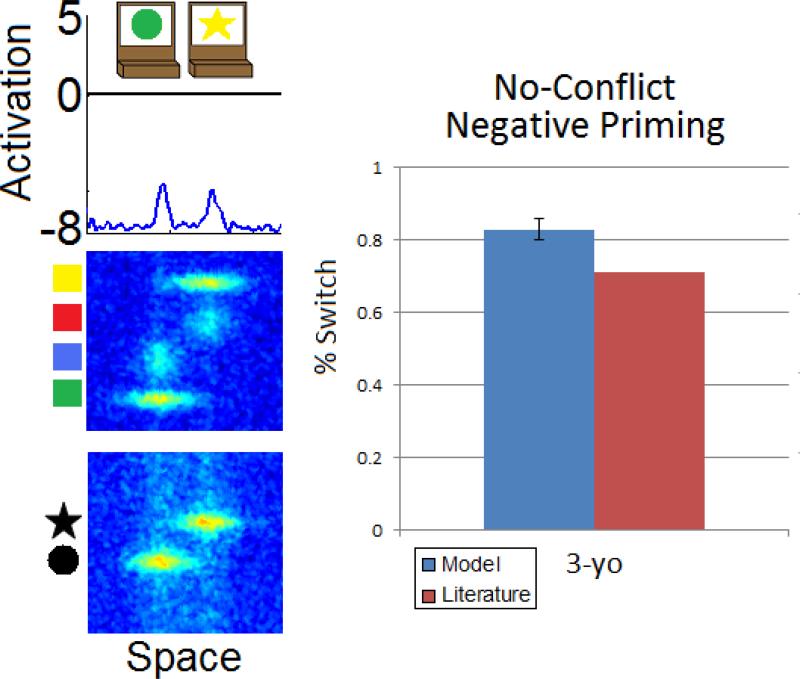
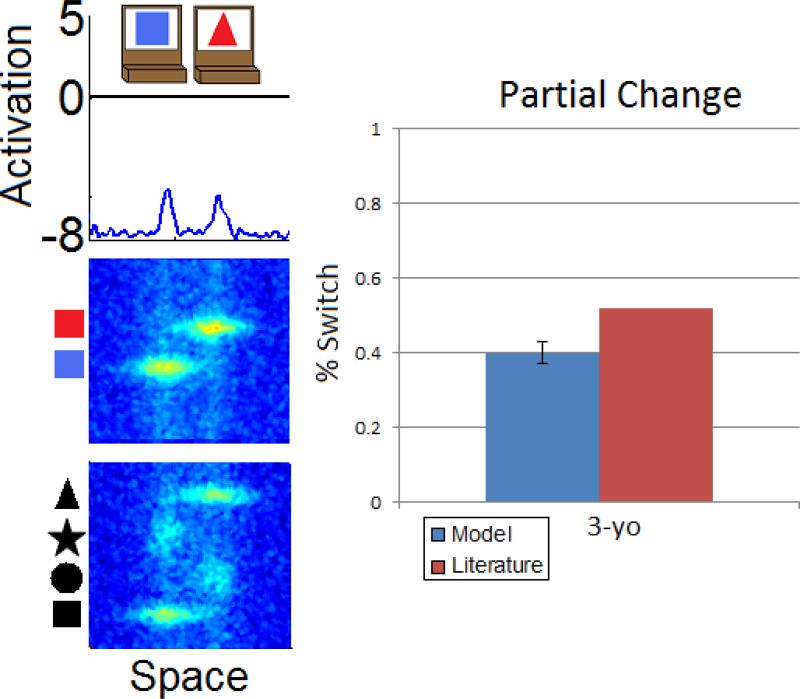
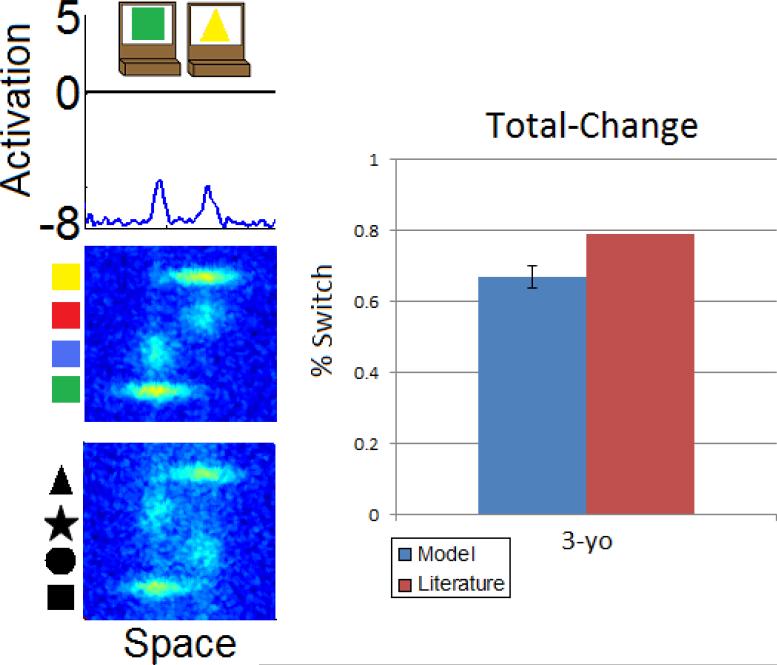
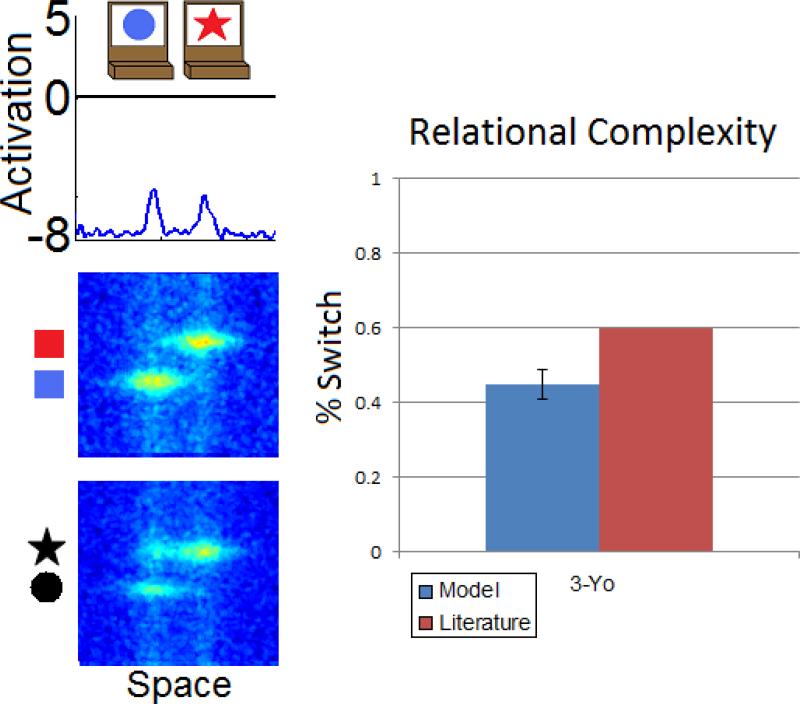
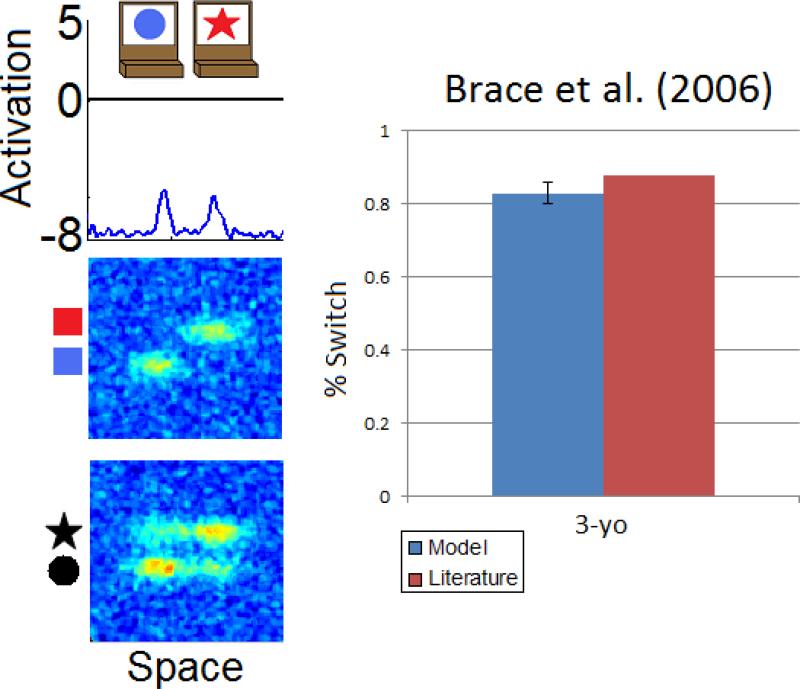
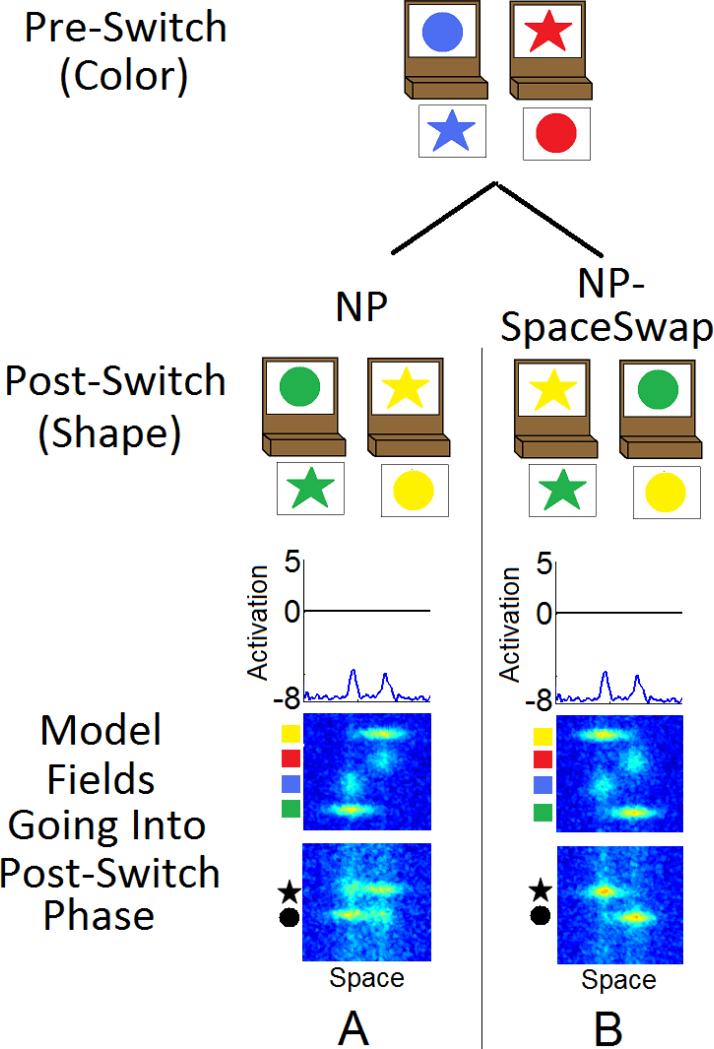
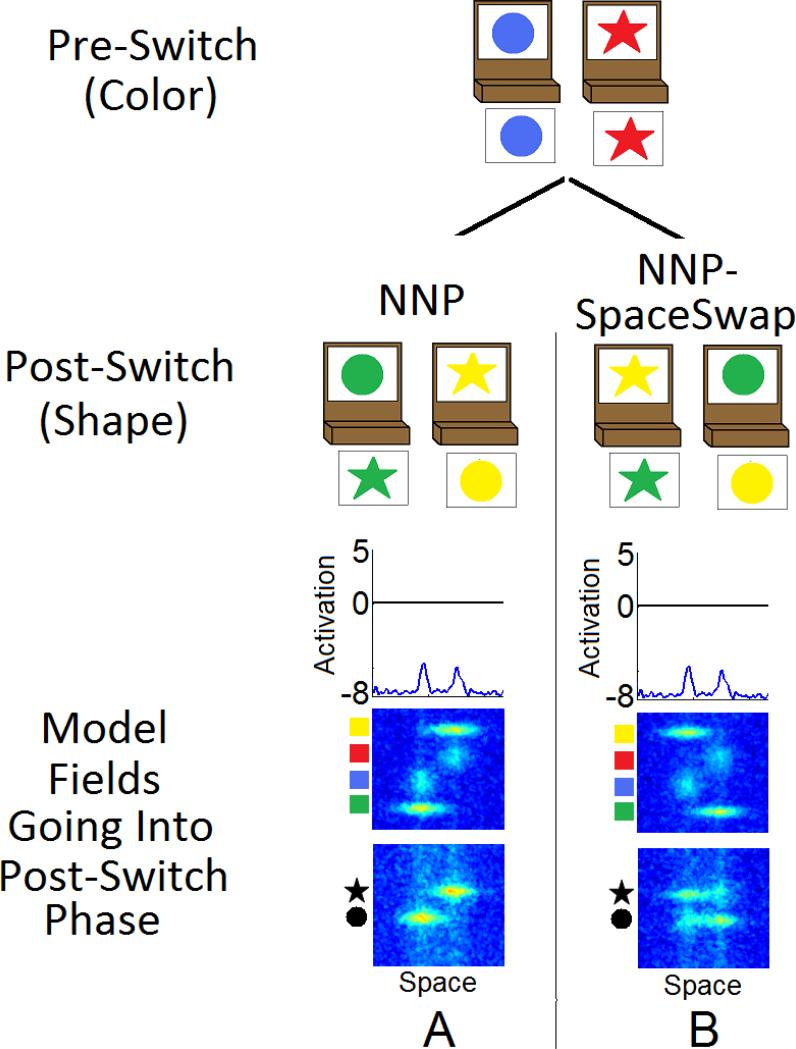
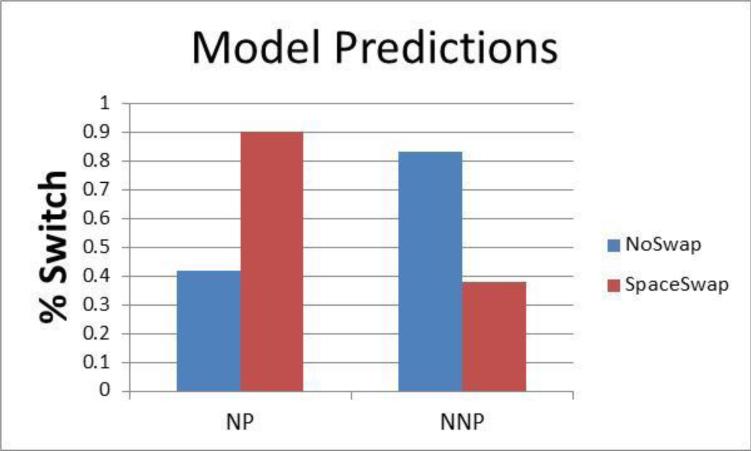
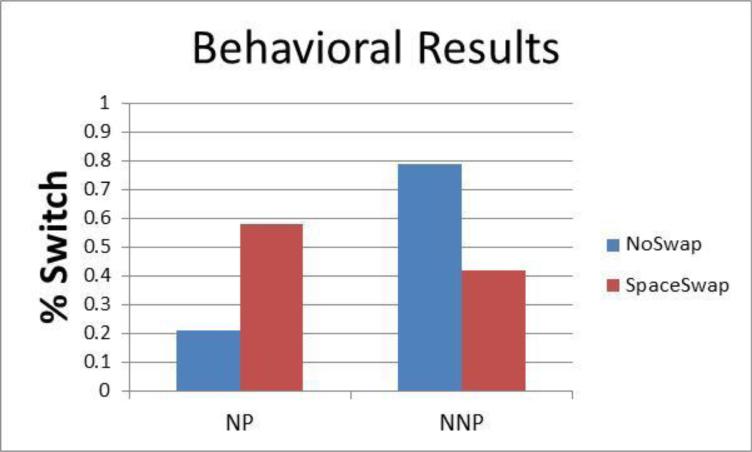
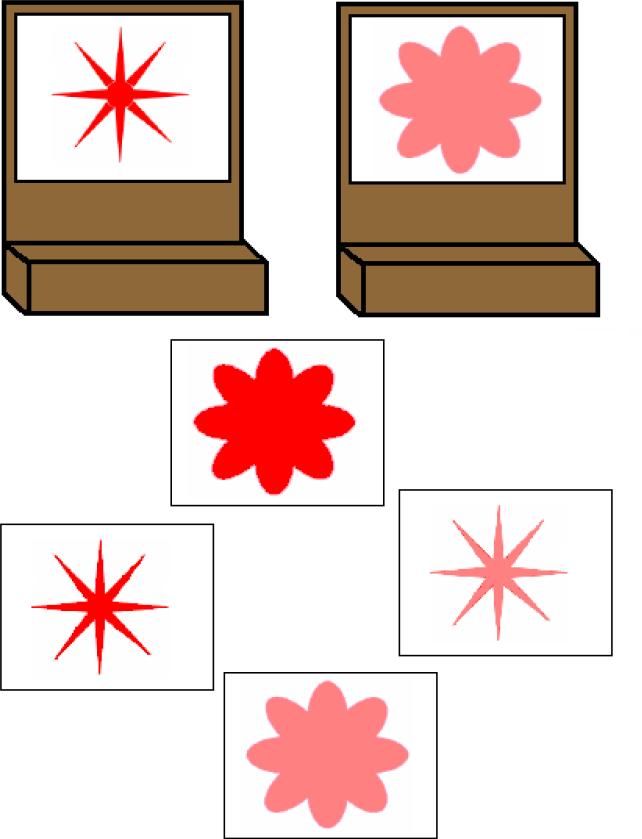
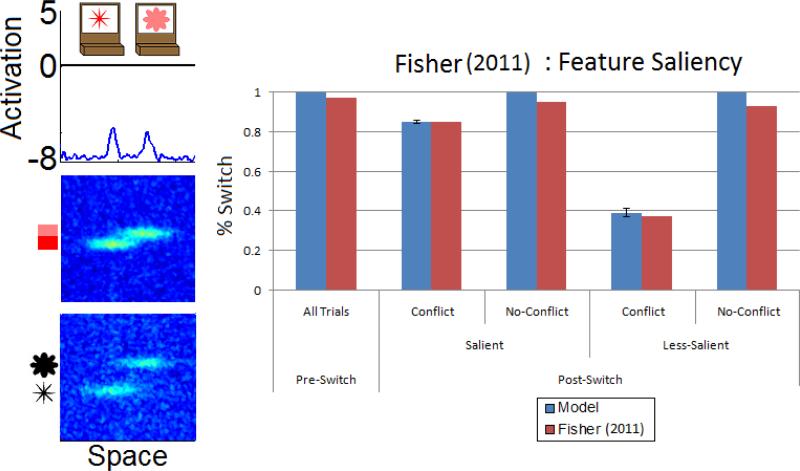
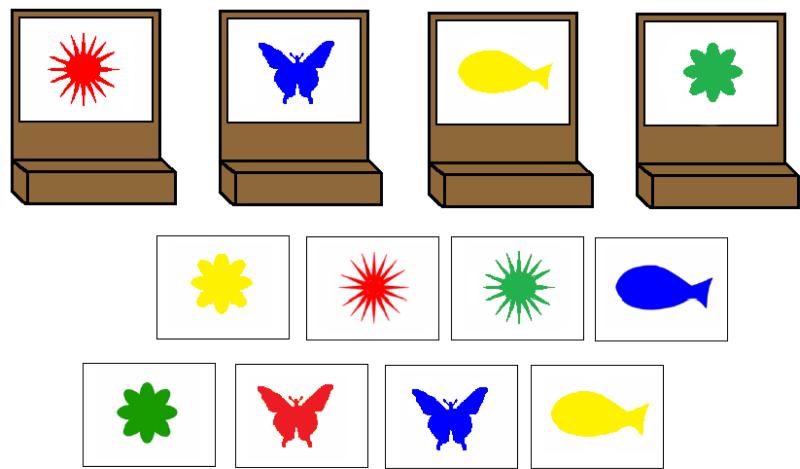
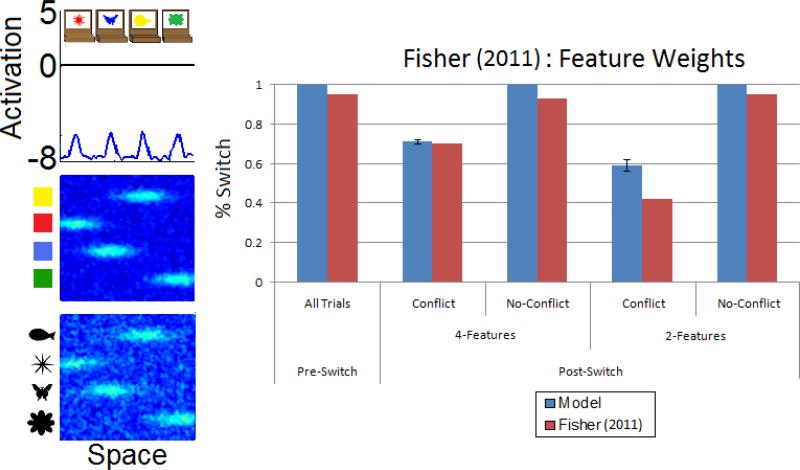
Executive function (EF) is a central aspect of cognition that undergoes significant changes in early childhood. Changes in EF in early childhood are robustly predictive of academic achievement and general quality of life measures later in adulthood. We present a dynamic neural field (DNF) model that provides a process-based account of behavior and developmental change in a key task used to probe the early development of executive function—the Dimensional Change Card Sort (DCCS) task. In the DCCS, children must flexibly switch from sorting cards either by shape or color to sorting by the other dimension. Typically, 3-year-olds, but not 5-year-olds, lack the flexibility to do so and perseverate on the first set of rules when instructed to switch. Using the DNF model, we demonstrate how rule-use and behavioral flexibility come about through a form of dimensional attention. Further, developmental change is captured by increasing the robustness and precision of dimensional attention. Note that although this enables the model to effectively switch tasks, the dimensional attention system does not “know” the details of task-specific performance. Rather, correct performance emerges as a property of system–wide interactions. We show how this captures children’s behavior in quantitative detail across 14 versions of the DCCS task. Moreover, we successfully test a set of novel predictions with 3-year-old children from a version of the task not explained by other theories.


Figures

Figure 1
Figure 1
Target and test cards used in various versions of the DCCS. For all of the examples shown color is the pre-shape dimension and shape is the post-switch dimension.
Figure 2
Figure 2
The rule-hierarchy of the Cognitive Complexity and Control (CCC) Theory (Zelazo et al., 2003). Setting conditions determine if shape or color rules are to be used. The a's are different features of each dimension (a1 goes with a1 and a2 with a2 under each setting condition as the combination of features on the test cards). The c's are the different decisions to be made for each feature (i.e., where it is to be placed).
Figure 3
Figure 3
The PDP model proposed by Morton & Munakata (2002). Visual, verbal, and rule inputs are fed through a hidden layer and a PFC layer (which also feeds into the hidden layer and modifies the strength of the connections between the hidden layer and the output layer). Decisions are made in the output layer for which target card the test card should be matched.
Figure 4
Figure 4
WM fields for the feature binding model. Panel A depicts the model just after the inputs have been turned on. Panel B shows the WM fields after the inputs have reached threshold. Within fields, the neural interactions have been engaged to form a peak. Between fields, spatial activation is being shared (visible in the feature WM fields as the vertical ridge of activation) to anchor features together in the representation of an object with a particular shape and color. In Panel C the WM fields are shown after the inputs have turned off and excitation has relaxed to resting level. The contribution from LTM is now visible. The left panel shows the putative mapping of the different fields to cortical locations.
Figure 5
Figure 5
The object WM model, the dimensional attention architecture, and the putative mapping to cortex.
Figure 6
Figure 6
The sequence of events as the model sorts cards in the DCCS. For simplicity, only the spatial, color, and shape WM fields are shown in each panel. The top panel depicts the activation of the dimensional attention nodes over the 6 pre- and 6 post-switch trials (‘color’ is presented in right, ‘shape’ is presented in blue). In this example, color is the relevant dimension for the pre-switch and shape is the relevant dimension for the post-switch. Panel A shows the inputs for the target cards and trays. Panel B shows the input for a red circle test card. Panel C shows the model sorting this card to the right. Panel D shows the formation of Hebbian traces from making that decision (target inputs are circled in black ovals and HTs are circled in white). Panels E and F show the inputs and decision being made for a blue star during the pre-switch phase. Panel G shows the WM fields of the model going into the post-switch phase after sorting during pre-switch phase. Black ovals outline the target inputs, while white circles outline the HTs. Panel H shows the model perseverating and soring the blue circle by color even though the ‘shape’ node is now more strongly activated.
Figure 7
Figure 7
The 4-year-old model sorting during the pre- and post-switch phases. This figures shows the same sequence of events as Figure 6. Critically, Panel H shows the model correctly switching and sorting the red circle by shape. This is due to the robust activation of the dimensional nodes during each trial which provides strong top-down modulation of activation to the relevant feature field.
Figure 8
Figure 8
Schematic diagram depicting the simplified processes of boosting and shifting. For trials 1-6, the boost (.4) is applied to the pre-switch field (the color WM field) is the full boost value. At trial 7 a portion of the boost is shifted to post-switch field (the shape WM field) determined by the shift value (0.75).
Figure 9
Figure 9
H-boost distributions for 3- and 4-year-old models. The distribution for 3-year-olds is dominated by lower h-boost values, while the distribution for 4-year-olds is dominated by higher h-boost values reflecting the stronger mapping of the dimensional nodes to their relevant feature fields.
Figure 10
Figure 10
Shift-value distributions for 3- and 4-year-old models. The 3-year-old distribution covers a wide range of intermediary value while the 4-year-old distribution is skewed to values closer to 1 capturing the increasing fidelity with which the dimensional nodes are able to achieve robust selective activation.
Figure 11
Figure 11
WM fields of the model at the beginning of the post-switch phase and simulation results for the Standard version.
Figure 12
Figure 12
WM fields of the model at the beginning of the post-switch phase and simulation results for the No-Conflict Standard version.
Figure 13
Figure 13
WM fields for the model at the beginning of the post-switch phase and simulation results for the NP version.
Figure 14
Figure 14
WM fields for the model at the beginning of the post-switch phase and simulation results for the No-Conflict NP version.
Figure 15
Figure 15
WM fields for the model at the beginning of the post-switch phase and simulation results for the Partial-Change version.
Figure 16
Figure 16
WM fields for the model at the beginning of the post-switch phase and simulation results for the Total-Change version.
Figure 17
Figure 17
WM fields for the model at the beginning of the post-switch phase and simulation results for the Relational Complexity version.
Figure 18
Figure 18
WM fields for the model at the beginning of the post-switch phase and simulation results for the training study by Brace, Morton, & Munakata (2006).
Figure 19
Figure 19
Model at the start of the pre-switch phase for the NP and NPS versions. In this example, color is the pre-switch dimension and shape is the post-switch dimension. In panel B conflict in the post-switch (shape) WM field is eliminated by swapping the locations of the target cards.
Figure 20
Figure 20
Model at the start of the pre-switch phase for the NNP and NNPS versions. In this example, color is the pre-switch dimension and shape is the post-switch dimension. In panel B conflict is introduced in the post-switch (shape) WM field swapping the locations of the target cards.
Figure 21
Figure 21
Simulated predictions of 3-year-olds’ performance in the SpaceSwap versions.
Figure 22
Figure 22
Children's performance in the NP and NNP versions plotted as a function of whether the target cards swapped locations for the post-switch phase.
Figure 23
Figure 23
Cards used in the feature-saliency version by Fisher (2011).
Figure 24
Figure 24
Inputs to the object WM model and quantitative fits of the feature-saliency versions in Fisher (2011).
Figure 25
Figure 25
Cards used in the feature-weights version by Fisher (2011).
Figure 26
Figure 26
Inputs to the object WM model and quantitative fits of the attentional-weights versions in Fisher (2011).

Comment in

References

    1. Aggelopoulos NC, Rolls ET. Scene perception: inferior temporal cortex neurons encode the positions of different objects in the scene. European Journal of Neuroscience. 2005;22:2903–2916. - PubMed
    1. Amari S. Dynamics of pattern formation in lateral-inhibition type neural fields. Biological Cybernetics. 1977;27:77–87. - PubMed
    1. Amari S. Topographic organization of nerve fields. Bulletin of Mathematical Biology. 1980;42:339–364. - PubMed
    1. Amari S, Arbib MA. Competition and cooperation in neural nets. In: Metzler J, editor. Systems Neuroscience. Academic Press; New York: 1977.
    1. Andersen RA. Encoding of intention and spatial location in the posterior parietal cortex. Cerebral Cortex. 1995;5:457–469. - PubMed

Publication types