

High resolution MALDI imaging mass spectrometry of retinal tissue lipids
- PMID: 24819461
- PMCID: PMC4180438
- DOI: 10.1007/s13361-014-0883-2
High resolution MALDI imaging mass spectrometry of retinal tissue lipids
Abstract
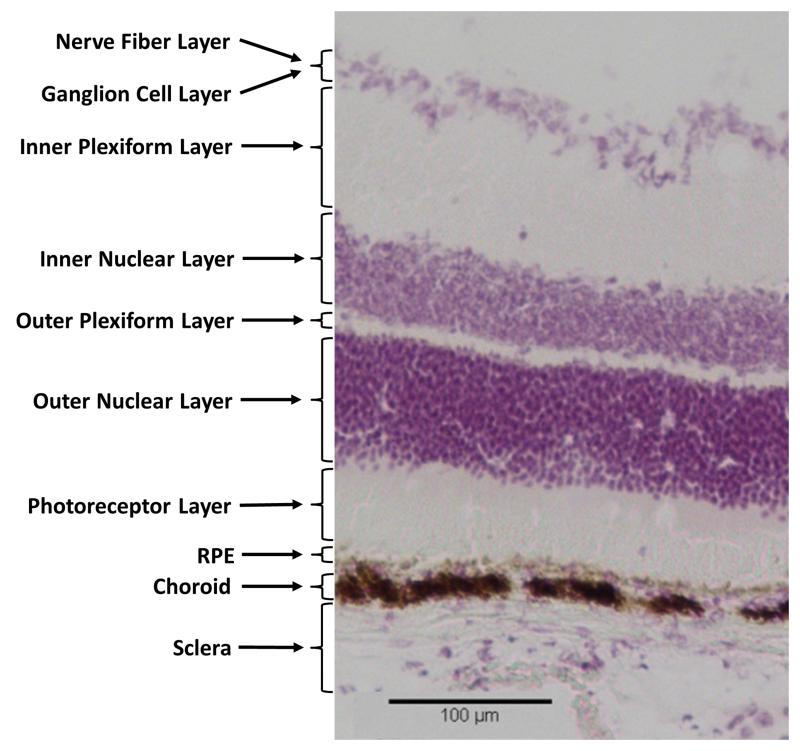
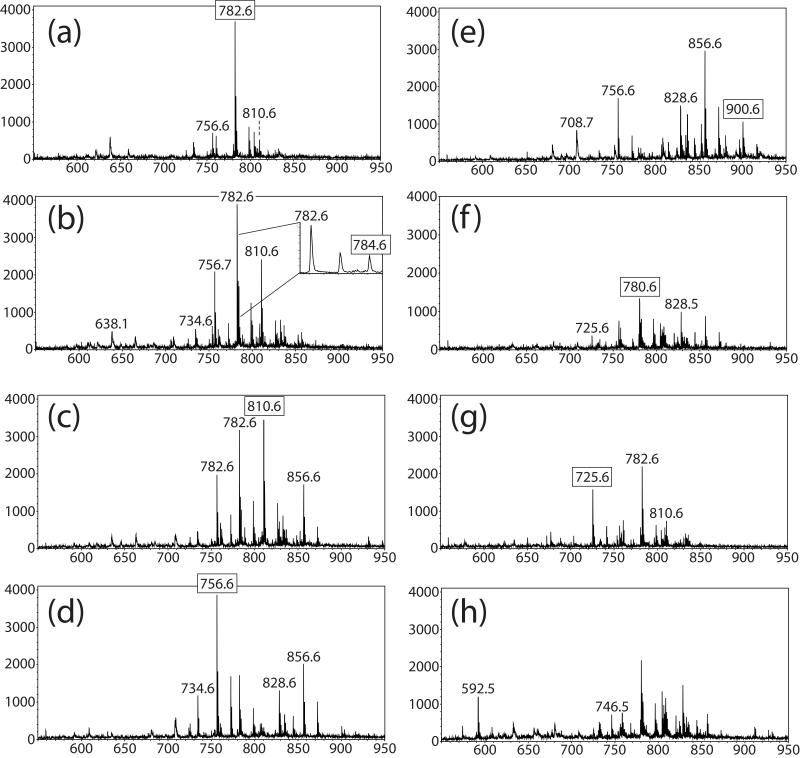
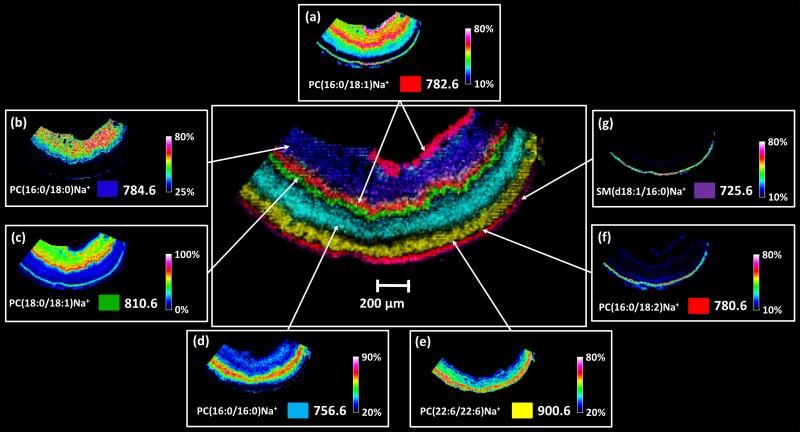
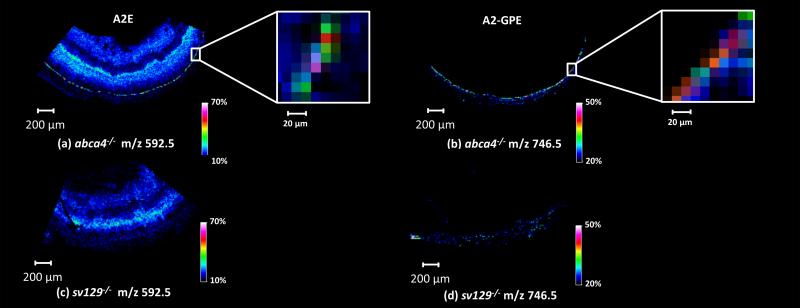
Matrix assisted laser desorption ionization imaging mass spectrometry (MALDI IMS) has the ability to provide an enormous amount of information on the abundances and spatial distributions of molecules within biological tissues. The rapid progress in the development of this technology significantly improves our ability to analyze smaller and smaller areas and features within tissues. The mammalian eye has evolved over millions of years to become an essential asset for survival, providing important sensory input of an organism's surroundings. The highly complex sensory retina of the eye is comprised of numerous cell types organized into specific layers with varying dimensions, the thinnest of which is the 10 μm retinal pigment epithelium (RPE). This single cell layer and the photoreceptor layer contain the complex biochemical machinery required to convert photons of light into electrical signals that are transported to the brain by axons of retinal ganglion cells. Diseases of the retina, including age-related macular degeneration (AMD), retinitis pigmentosa, and diabetic retinopathy, occur when the functions of these cells are interrupted by molecular processes that are not fully understood. In this report, we demonstrate the use of high spatial resolution MALDI IMS and FT-ICR tandem mass spectrometry in the Abca4(-/-) knockout mouse model of Stargardt disease, a juvenile onset form of macular degeneration. The spatial distributions and identity of lipid and retinoid metabolites are shown to be unique to specific retinal cell layers.
Figures
References
-
- Mullins RF, Skeie JM. Essentials of Retinal Morphology Animals Models for Retinal Diseases. Neuromethods New York City (NY) 2010;Vol. 46
-
- Leonardo Da Vinci . Anatomy of the eye, section of a man’s head. Royal Library; Windsor Castle:
-
- Miyazawa T, Nakagawa K, Shimasaki S, Nagai R. Lipid glycation and protein glycation in diabetes and atherosclerosis. Amino Acids. 2012;42:1163–70. - PubMed
-
- Antonetti DA, Klein R, Gardner TW. Diabetic Retinopathy. N. Engl. J. Med. 2012;366:1227–1239. - PubMed
Publication types
MeSH terms
Substances
Grants and funding
LinkOut - more resources
Full Text Sources
Other Literature Sources
