

Simultaneous assessment of rotavirus-specific memory B cells and serological memory after B cell depletion therapy with rituximab
- PMID: 24819618
- PMCID: PMC4018270
- DOI: 10.1371/journal.pone.0097087
Simultaneous assessment of rotavirus-specific memory B cells and serological memory after B cell depletion therapy with rituximab
Abstract
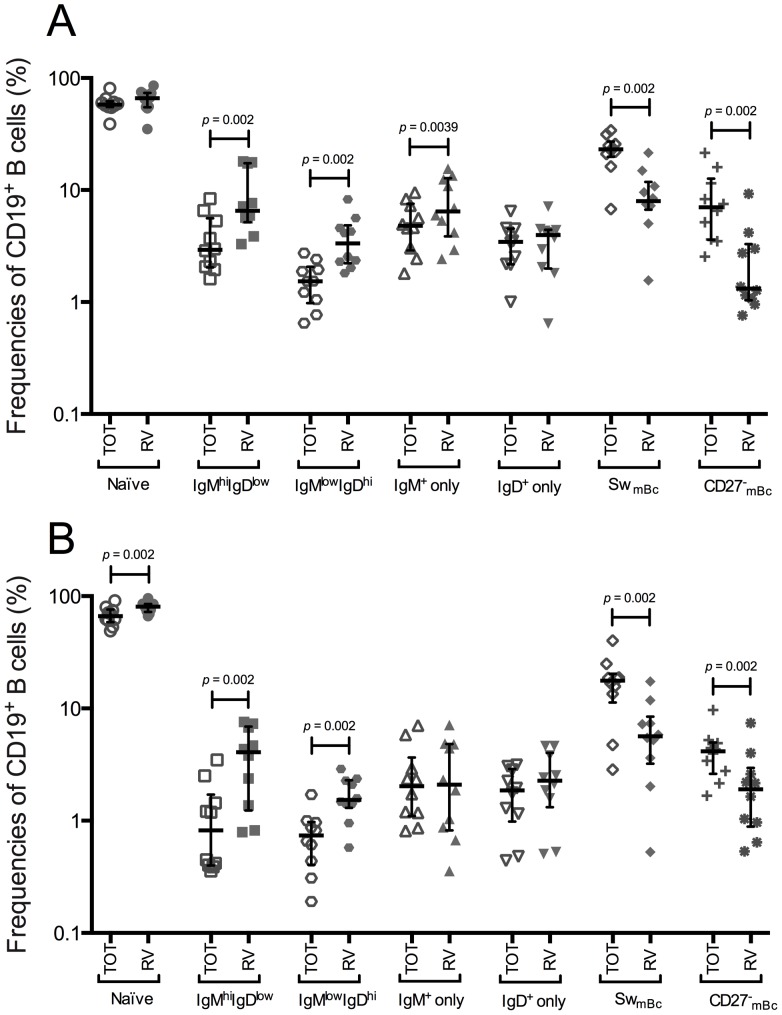
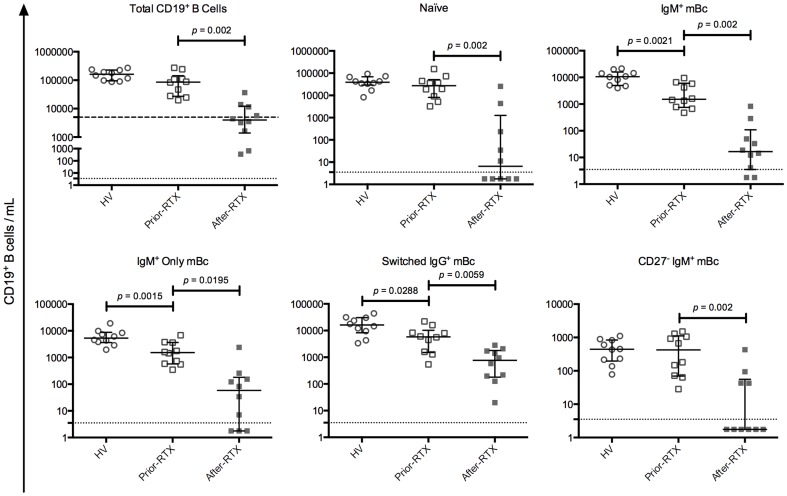
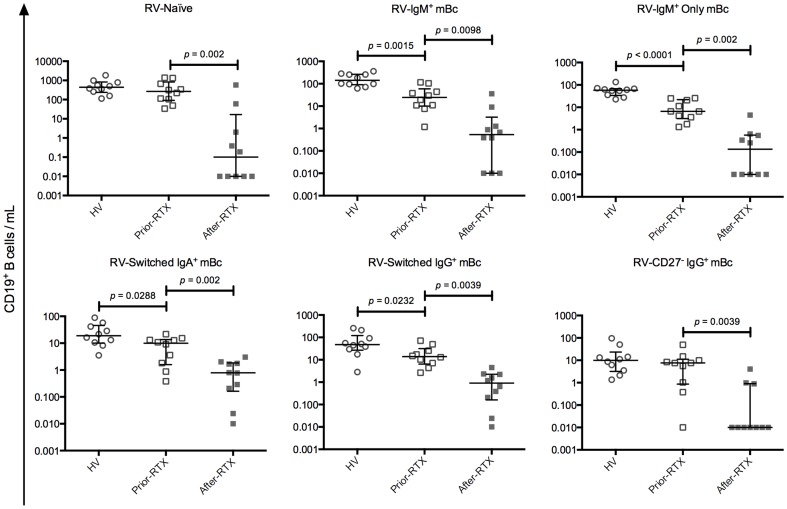
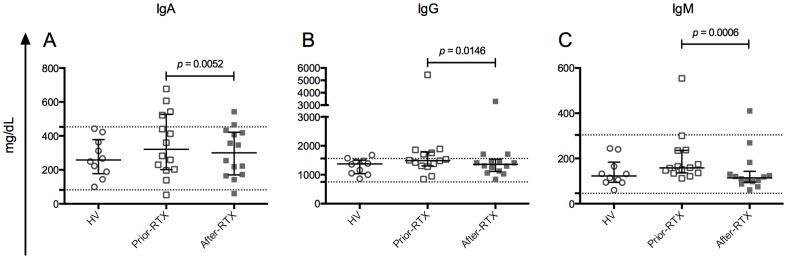
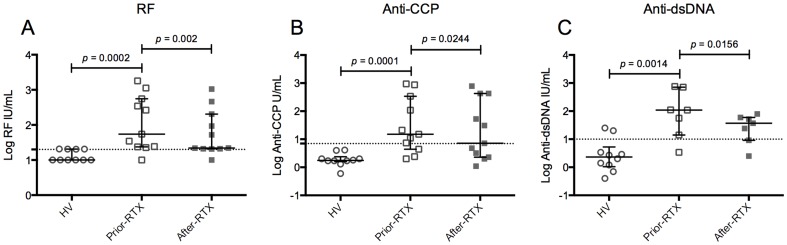
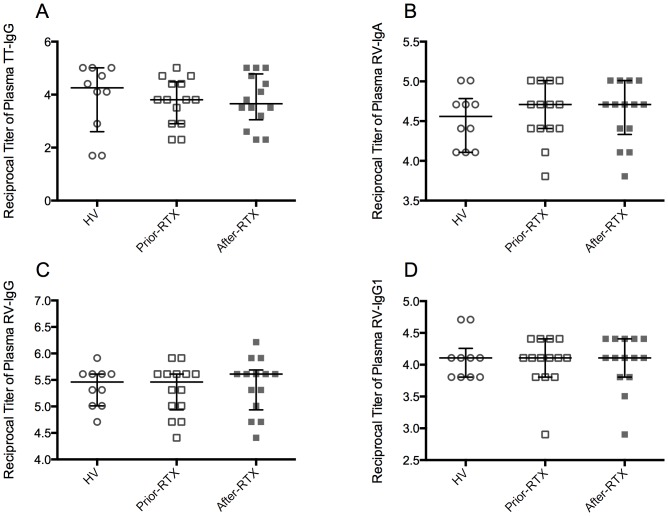
The mechanisms that contribute to the maintenance of serological memory are still unclear. Rotavirus (RV) memory B cells (mBc) are enriched in IgM(+) and CD27- subpopulations, which are associated with autoimmune diseases pathogenesis. In patients with autoimmune diseases treated with Rituximab (RTX), some autoantibodies (auto-Abs) decrease after treatment, but other auto-Abs and pathogen-specific IgG Abs remain unchanged. Thus, maintenance of autoimmune and pathogen-specific serological memory may depend on the type of antigen and/or Ab isotype evaluated. Antigen-specific mBc and antigen-specific Abs of different isotypes have not been simultaneously assessed in patients after RTX treatment. To study the relationship between mBc subpopulations and serological memory we characterized total, RV- and tetanus toxoid (TT)-specific mBc by flow cytometry in patients with autoimmune diseases before and after treatment with RTX. We also measured total, RV- and TT-Abs, and some auto-Abs by kinetic nephelometry, ELISA, and EliA tests, respectively. Minor differences were observed between the relative frequencies of RV-mBc in healthy controls and patients with autoimmune disease. After RTX treatment, naïve Bc and total, RV- and TT-specific mBc [IgM(+), switched (IgA(+)/IgG(+)), IgM(+) only, IgD(+) only, and CD27- (IgA(+)/IgG(+)/IgM(+))] were significantly diminished. An important decrease in total plasma IgM and minor decreases in total IgG and IgA levels were also observed. IgM rheumatoid factor, IgG anti-CCP, and IgG anti-dsDNA were significantly diminished. In contrast, RV-IgA, RV-IgG and RV-IgG1, and TT-IgG titers remained stable. In conclusion, in patients with autoimmunity, serological memory against RV and TT seem to be maintained by long-lived plasma cells, unaffected by RTX, and an important proportion of total IgM and serological memory against some auto-antigens seem to be maintained by short-lived plasma cells, dependent on mBc precursors depleted by RTX.
Conflict of interest statement
Figures
Similar articles
-
Characterization of rotavirus specific B cells and their relation with serological memory.Virology. 2008 Oct 25;380(2):234-42. doi: 10.1016/j.virol.2008.08.004. Epub 2008 Sep 11. Virology. 2008. PMID: 18789807 Free PMC article.
-
The effect of B-cell depletion therapy on serological evidence of B-cell and plasmablast activation in patients with rheumatoid arthritis over multiple cycles of rituximab treatment.J Autoimmun. 2014 May;50:67-76. doi: 10.1016/j.jaut.2013.12.002. Epub 2013 Dec 22. J Autoimmun. 2014. PMID: 24365380
-
Human rotavirus-specific IgM Memory B cells have differential cloning efficiencies and switch capacities and play a role in antiviral immunity in vivo.J Virol. 2012 Oct;86(19):10829-40. doi: 10.1128/JVI.01466-12. Epub 2012 Aug 1. J Virol. 2012. PMID: 22855480 Free PMC article.
-
B cell subsets reconstitution and immunoglobulin levels in children and adolescents with B non-Hodgkin lymphoma after treatment with single anti CD20 agent dose included in chemotherapeutic protocols: single center experience and review of the literature.Biomed Pap Med Fac Univ Palacky Olomouc Czech Repub. 2024 Jun;168(2):167-176. doi: 10.5507/bp.2023.021. Epub 2023 May 23. Biomed Pap Med Fac Univ Palacky Olomouc Czech Repub. 2024. PMID: 37227099 Review.
-
Memory control by the B cell antigen receptor.Immunol Rev. 2018 May;283(1):150-160. doi: 10.1111/imr.12651. Immunol Rev. 2018. PMID: 29664567 Review.
Cited by
-
Lipopolysaccharide Attenuates CD40 Ligand-Induced Regulatory B10 Cell Expansion and IL-10 Production in Mouse Splenocytes.Open J Immunol. 2015 Mar;5(1):1-8. doi: 10.4236/oji.2015.51001. Open J Immunol. 2015. PMID: 26236564 Free PMC article.
-
HPV-Specific Systemic Antibody Responses and Memory B Cells are Independently Maintained up to 6 Years and in a Vaccine-Specific Manner Following Immunization with Cervarix and Gardasil in Adolescent and Young Adult Women in Vaccination Programs in Italy.Vaccines (Basel). 2020 Jan 14;8(1):26. doi: 10.3390/vaccines8010026. Vaccines (Basel). 2020. PMID: 31947611 Free PMC article.
-
Rapid Proliferation and Differentiation of a Subset of Circulating IgM Memory B Cells to a CpG/Cytokine Stimulus In Vitro.PLoS One. 2015 Oct 6;10(10):e0139718. doi: 10.1371/journal.pone.0139718. eCollection 2015. PLoS One. 2015. PMID: 26439739 Free PMC article.
-
Factors Affecting Early Antibody Secreting Cell Maturation Into Long-Lived Plasma Cells.Front Immunol. 2019 Sep 11;10:2138. doi: 10.3389/fimmu.2019.02138. eCollection 2019. Front Immunol. 2019. PMID: 31572364 Free PMC article. Review.
-
Immunoinformatics Approach for Epitope-Based Peptide Vaccine Design and Active Site Prediction against Polyprotein of Emerging Oropouche Virus.J Immunol Res. 2018 Oct 8;2018:6718083. doi: 10.1155/2018/6718083. eCollection 2018. J Immunol Res. 2018. PMID: 30402510 Free PMC article.
References
-
- Amanna IJ, Carlson NE, Slifka MK (2007) Duration of humoral immunity to common viral and vaccine antigens. N Engl J Med 357: 1903–1915. - PubMed
-
- Ahmed R, Gray D (1996) Immunological memory and protective immunity: understanding their relation. Science 272: 54–60. - PubMed
-
- Dunning AJ (2006) A model for immunological correlates of protection. Stat Med 25: 1485–1497. - PubMed
-
- Uysal H, Nandakumar KS, Kessel C, Haag S, Carlsen S, et al. (2010) Antibodies to citrullinated proteins: molecular interactions and arthritogenicity. Immunol Rev 233: 9–33. - PubMed
Publication types
MeSH terms
Substances
LinkOut - more resources
Full Text Sources
Other Literature Sources
Research Materials
Miscellaneous
