. 2014 May 12;2(5):e00286.
doi: 10.14814/phy2.286. Print 2014.

Biochemical artifacts in experiments involving repeated biopsies in the same muscle

Affiliations

Biochemical artifacts in experiments involving repeated biopsies in the same muscle

Ruud Van Thienen et al. Physiol Rep. .

Abstract

Needle biopsies are being extensively used in clinical trials addressing muscular adaptation to exercise and diet. Still, the potential artifacts due to biopsy sampling are often overlooked. Healthy volunteers (n = 9) underwent two biopsies through a single skin incision in a pretest. Two days later (posttest) another biopsy was taken 3 cm proximally and 3 cm distally to the pretest incision. Muscle oxygenation status (tissue oxygenation index [TOI]) was measured by near-infrared spectroscopy. Biopsy samples were analyzed for 40 key markers (mRNA and protein contents) of myocellular O2 sensing, inflammation, cell proliferation, mitochondrial biogenesis, protein synthesis and breakdown, oxidative stress, and energy metabolism. In the pretest, all measurements were identical between proximal and distal biopsies. However, compared with the pretest, TOI in the posttest was reduced in the proximal (-10%, P < 0.05), but not in the distal area. Conversely, most inflammatory markers were upregulated at the distal (100-500%, P < 0.05), but not at the proximal site. Overall, 29 of the 40 markers measured, equally distributed over all pathways studied, were either up- or downregulated by 50-500% (P < 0.05). In addition, 19 markers yielded conflicting results between the proximal and distal measurements (P < 0.05). This study clearly documents that prior muscle biopsies can cause major disturbances in myocellular signaling pathways in needle biopsies specimens sampled 48 h later. In addition, different biopsy sites within identical experimental conditions yielded conflicting results.

Keywords: Biochemistry; exercise; gene expression; muscle oxygenation; needle biopsy; protein expression; skeletal muscle.


Figures

Figure 1.
Figure 1.
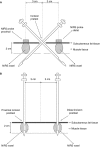
Positioning of the NIRS probes on the biopsy leg and the control leg. Frontal view of the positioning of the NIRS probes relative to the skin incision for muscle biopsying in the right m. vastus lateralis in the pretest. Probe positions were mirrored in the intact left leg which served as a control. The horizontal dotted line indicates the sagittal section as shown in Figure 2. See Methods for further details.
Figure 2.
Figure 2.
Positioning of the muscle biopsies relative to the skin incision and the appearance of the NIRS voxels in m. vastus lateralis. The picture shows a sagittal section of m. vastus lateralis. The hatched areas indicate the dimensions of the NIRS voxels. Panels A and B show the orientation of the biopsy needle in the pretest and the posttest, respectively. See Methods for further details.
Figure 3.
Figure 3.
Effect of needle biopsying on muscle oxygenation status. Values are means ± SEM (n = 9) and represent muscle tissue oxygenation index (TOI, %) measured by NIRS in the pretest and in the posttest. Biopsies were taken as shown in Figure 2. A standard biopsy procedure was performed in m. vastus lateralis while TOI was measured by near‐infrared spectroscopy 3 cm proximal and 3 cm distal to the pretest incision site. The contralateral leg served as a control leg. See Methods for further details. *P < 0.05 compared with control leg. §P < 0.05 compared with pretest.
Figure 4.
Figure 4.
Effect of needle biopsying on key markers in myocellular oxygen sensing. Data are means ± SEM (n = 9) and are expressed as fold increase relative to the baseline obtained from the pretest biopsies. mRNA (left panel) and protein content (right panel) were measured in muscle tissue sampled by needle biopsy either 3 cm proximal (open bars) or 3 cm distal (filled bars) to the pretest incision. See Methods for further details. *P < 0.05 compared with proximal, §P < 0.05 compared with pretest.
Figure 5.
Figure 5.
Effect of needle biopsying on key markers in myocellular inflammation. Data are means ± SEM (n = 9) and are expressed as fold increase relative to the baseline obtained from the pretest biopsies. mRNA (left panel) and protein content (right panel) were measured in muscle tissue sampled by needle biopsy either 3 cm proximal (open bars) or 3 cm distal (filled bars) to the pretest incision. See Methods for further details. *P < 0.05 compared with proximal, §P < 0.05 compared with pretest.
Figure 6.
Figure 6.
Effect of needle biopsying on key markers in skeletal myogenesis and cell proliferation. Data are means ± SEM (n = 9) and are expressed as fold increase relative to the baseline obtained from the pretest biopsies. mRNA content was measured in muscle tissue sampled by needle biopsy either 3 cm proximal (open bars) or 3 cm distal (filled bars) to the pretest incision. See Methods for further details. *P < 0.05 compared with proximal, §P < 0.05 compared with pretest.
Figure 7.
Figure 7.
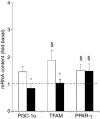
Effect of needle biopsying on key markers in mitochondrial biogenesis and regulation. Data are means ± SEM (n = 9) and are expressed as fold increase relative to the baseline obtained from the pretest biopsies. mRNA content was measured in muscle tissue sampled by needle biopsy either 3 cm proximal (open bars) or 3 cm distal (filled bars) to the pretest incision. See Methods for further details. *P < 0.05 compared with proximal, §P < 0.05 compared with pretest.
Figure 8.
Figure 8.
Effect of needle biopsying on key markers in protein synthesis and breakdown. Data are means ± SEM (n = 9) and are expressed as fold increase relative to the baseline obtained from the pretest biopsies. mRNA (left panel) and protein phosphorylation status (S6K1, Akt, and eIF2α) (right panel) were measured in muscle tissue sampled by needle biopsy either 3 cm proximal (open bars) or 3 cm distal (filled bars) to the pretest incision. See Methods for further details. *P < 0.05 compared with proximal, §P < 0.05 compared with pretest.
Figure 9.
Figure 9.
Effect of needle biopsying on key markers in oxidative stress. Data are means ± SEM (n = 9) and are expressed as fold increase relative to the baseline obtained from the pretest biopsies. mRNA content was measured in muscle tissue sampled by needle biopsy either 3 cm proximal (open bars) or 3 cm distal (filled bars) to the pretest incision. See Methods for further details. *P < 0.05 compared with proximal, §P < 0.05 compared with pretest.
Figure 10.
Figure 10.
Effect of needle biopsying on key markers in glucose and lipid metabolism. Data are means ± SEM (n = 9) and are expressed as fold increase relative to the baseline obtained from the pretest biopsies. mRNA (left panel) and protein phosphorylation status (AMPK) or phosphorylated protein content (GSK‐3) (right panel) were measured in muscle tissue sampled by needle biopsy either 3 cm proximal (open bars) or 3 cm distal (filled bars) to the pretest incision. See Methods for further details. *P < 0.05 compared with proximal, §P < 0.05 compared with pretest.

References

    1. Ameln H., Gustafsson T., Sundberg C. J., Okamoto K., Jansson E., Poellinger L. 2005. Physiological activation of hypoxia inducible factor‐1 in human skeletal muscle. FASEB J.; 19:1009-1011 - PubMed
    1. Bergstrom J. 1963. Clinical studies on cell electrolytes. Scand. J. Clin. Lab. Invest.; 15Suppl. 76:16-18 - PubMed
    1. Bergstrom J. 1975. Percutaneous needle biopsy of skeletal muscle in physiological and clinical research. Scand. J. Clin. Lab. Invest.; 35:609-616 - PubMed
    1. Bokoch G. M., Knaus U. G. 2003. NADPH oxidases: not just for leukocytes anymore!. Trends Biochem. Sci.; 28:502-508 - PubMed
    1. Boushel R., Langberg H., Olesen J., Gonzales‐Alonzo J., Bulow J., Kjaer M. 2001. Monitoring tissue oxygen availability with near infrared spectroscopy (NIRS) in health and disease. Scand. J. Med. Sci. Sports; 11:213-222 - PubMed