. 2014 Jul;165(3):1344-1352.
doi: 10.1104/pp.114.240432. Epub 2014 May 12.

Plastidial Expression of Type II NAD(P)H Dehydrogenase Increases the Reducing State of Plastoquinones and Hydrogen Photoproduction Rate by the Indirect Pathway in Chlamydomonas reinhardtii1

Affiliations

Plastidial Expression of Type II NAD(P)H Dehydrogenase Increases the Reducing State of Plastoquinones and Hydrogen Photoproduction Rate by the Indirect Pathway in Chlamydomonas reinhardtii1

Anthony Baltz et al. Plant Physiol. 2014 Jul.

Abstract

Biological conversion of solar energy into hydrogen is naturally realized by some microalgae species due to a coupling between the photosynthetic electron transport chain and a plastidial hydrogenase. While promising for the production of clean and sustainable hydrogen, this process requires improvement to be economically viable. Two pathways, called direct and indirect photoproduction, lead to sustained hydrogen production in sulfur-deprived Chlamydomonas reinhardtii cultures. The indirect pathway allows an efficient time-based separation of O2 and H2 production, thus overcoming the O2 sensitivity of the hydrogenase, but its activity is low. With the aim of identifying the limiting step of hydrogen production, we succeeded in overexpressing the plastidial type II NAD(P)H dehydrogenase (NDA2). We report that transplastomic strains overexpressing NDA2 show an increased activity of nonphotochemical reduction of plastoquinones (PQs). While hydrogen production by the direct pathway, involving the linear electron flow from photosystem II to photosystem I, was not affected by NDA2 overexpression, the rate of hydrogen production by the indirect pathway was increased in conditions, such as nutrient limitation, where soluble electron donors are not limiting. An increased intracellular starch was observed in response to nutrient deprivation in strains overexpressing NDA2. It is concluded that activity of the indirect pathway is limited by the nonphotochemical reduction of PQs, either by the pool size of soluble electron donors or by the PQ-reducing activity of NDA2 in nutrient-limited conditions. We discuss these data in relation to limitations and biotechnological improvement of hydrogen photoproduction in microalgae.


Figures

Figure 1.
Figure 1.
Constructs used for overexpression of CrNDA2 in the C. reinhardtii plastid genome and preliminary characterization of transformants. A, Vectors used for the plastid transformation of the ATPase-deficient mutant FUD50. The vector harbors two homologous recombination regions (HR1 and HR2) and the CrNDA2 gene (or the aadA gene for transformation controls) under control of the psaA 5′ UTR promoter region and the 3′ UTR rbcL region; putative transformants were screened based on their ability to grow photoautrophically. B, PCR-based characterization of plastid transformants using CpNDA2 primers (shown by black arrows in A), homoplasmy primers (shown by asterisks in A), and 16S primers used as a positive control. C, Immunodetection of a 61-kD protein band using an antibody directed against recombinant CrNDA2; quantitative analysis showed a 1.7 ± 0.2 sd (n = 3) increase in CrNDA2 amounts in CrNDA2+ compared with the control line; Coomassie Blue-stained loading controls are shown at bottom. D, State transitions monitored by low temperature (77 K) chlorophyll fluorescence spectra in control (gray line) and CrNDA2+ cells (black line). Ratios between emission fluorescence signals measured at 685 nm and 715 nm (E685/E715) determined in control (gray box) and CrNDA2+ cells (black box) are shown in the insert as means ± sds (n = 3).
Figure 2.
Figure 2.
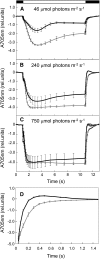
Oxidation/reduction kinetics for the primary electron donor to PSI, P700, and CEF measurements in CrNDA2+ cells. Cultured cells shown were poisoned with the PSII inhibitor DCMU (30 μm final concentration) before measurements. Absorption changes were measured at 705 nm during a dark-light-dark transient as indicated by the top boxes. A, Light intensity was 46 µmol photons m–2 s–1. B, Light intensity was 240 µmol photons m–2 s–1. C, Light intensity was 750 µmol photons m–2 s–1. D, Zoom on the P700+ rereduction kinetics in the dark after an illumination at 240 µmol photons m–2 s–1. Control (gray lines) and CrNDA2+ cells (black lines). The P700-to-chlorophyll ratio, which was determined as described by Johnson and Alric (2012), was 1,100:1. Shown are means ± sds (n = 3).
Figure 3.
Figure 3.
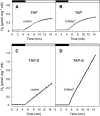
Short-term hydrogen photoproduction by the indirect pathway measured in CrNDA2+ C. reinhardtii cells. Hydrogen production was measured using a membrane inlet mass spectrometer following 45-min anaerobic incubation in the dark of exponentially dividing cells (4 × 10⁶ cells mL–1, corresponding to 18 µg chlorophyll mL–1). When indicated by the top box, light (800 µmol photons m–2 s–1 PAR) was switched on. The PSII inhibitor DCMU (final concentration, 20 µm) was added 4 min before the onset of illumination. A and B, Hydrogen production measured in control (A) and CrNDA2+ cells (B) exponentially grown in a TAP medium. C and D, Hydrogen production measured in control (C) and CrNDA2+ cells (D) after 2 d in sulfur-deprived TAP medium. Shown in gray dots are means ± sds (n = 3). chl, Chlorophyll.
Figure 4.
Figure 4.
Long-term hydrogen production and intracellular starch contents measured in response to sulfur deficiency. Exponentially growing cells were centrifuged, resuspended in a sulfur-free medium (the initial cellular concentration was 4 × 10⁶ cells mL–1, corresponding to 18 µg chlorophyll mL–1), and transferred in illuminated (200 µmol photons m–2 s–1) sealed flasks. From 0 to 24 h, the cell concentration increased from 4 × 10⁶ to 107 cells mL–1 and then remained constant. At 24 h (as indicated by an arrow), the cell suspension was bubbled with N2 to remove residual O2 and synchronize hydrogen production. A, Hydrogen production measured in the absence of DCMU. B, Hydrogen production measured in the presence of 20 µm DCMU. C, Intracellular starch measured as Glc equivalents during sulfur deficiency experiments performed in the absence of DCMU. D, Intracellular starch measured as Glc equivalents during sulfur deficiency experiment performed in the presence of 20 µm DCMU. Control (white circles) and CrNDA2+ cells (black circles). Shown are means ± sds (n = 3 for A and B; n = 5 for C and D). chl, Chlorophyll.
Figure 5.
Figure 5.
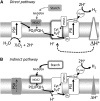
Schematic views of electron transfer pathways and limiting steps of direct and indirect hydrogen photoproduction. A, In the direct pathway, reducing equivalents generated at PSII are sequentially transferred to PQ, the cytochrome (Cyt) b6/f complex, plastocyanin (Pc), PSI, ferredoxin (Fd), and the hydrogenase (H2ase). The direct pathway has been proposed to be controlled by the proton gradient at the level of the cytochrome b6/f complex (Tolleter et al., 2011). B, In the indirect pathway, reducing equivalents generated by the photosynthetic electron transport chain during an aerobic phase are transiently stored as starch and, in turn, reinjected in the intersystem electron transport chain by NDA2 reducing PQs. According to this study, NDA2 activity limits the indirect pathway, provided the stromal electron donor pool, i.e. NAD(P)H supplied by starch catabolism, is not limiting. Electron transfer pathways are shown by arrows, and their respective limiting steps (cytochrome b6/f for the direct and NDA2 for the indirect) are surrounded by a gray light.

References

    1. Allen JF, Bennett J, Steinback KE, Arntzen CJ. (1981) Chloroplast protein phosphorylation couples plastoquinone redox state to distribution of excitation energy between photosystems. Nature 291: 25–29
    1. Alric J. (2010) Cyclic electron flow around photosystem I in unicellular green algae. Photosynth Res 106: 47–56 - PubMed
    1. Alric J, Lavergne J, Rappaport F. (2010) Redox and ATP control of photosynthetic cyclic electron flow in Chlamydomonas reinhardtii (I) aerobic conditions. Biochim Biophys Acta 1797: 44–51 - PubMed
    1. Antal TK, Krendeleva TE, Laurinavichene TV, Makarova VV, Ghirardi ML, Rubin AB, Tsygankov AA, Seibert M. (2003) The dependence of algal H2 production on photosystem II and O2 consumption activities in sulfur-deprived Chlamydomonas reinhardtii cells. Biochim Biophys Acta 1607: 153–160 - PubMed
    1. Antal TK, Volgusheva AA, Kukarskih GP, Krendeleva TE, Rubin AB. (2009) Relationships between H2 photoproduction and different electron transport pathways in sulfur-deprived Chlamydomonas reinhardtii. Int J Hydrogen Energy 34: 9087–9094

LinkOut - more resources