Single nucleotide polymorphisms reveal genetic structuring of the carpathian newt and provide evidence of interspecific gene flow in the nuclear genome
- PMID: 24820116
- PMCID: PMC4018350
- DOI: 10.1371/journal.pone.0097431
Single nucleotide polymorphisms reveal genetic structuring of the carpathian newt and provide evidence of interspecific gene flow in the nuclear genome
Erratum in
- PLoS One. 2014;9(6):e101352
Abstract
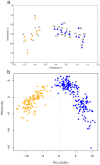
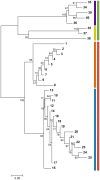
Genetic variation within species is commonly structured in a hierarchical manner which may result from superimposition of processes acting at different spatial and temporal scales. In organisms of limited dispersal ability, signatures of past subdivision are detectable for a long time. Studies of contemporary genetic structure in such taxa inform about the history of isolation, range changes and local admixture resulting from geographically restricted hybridization with related species. Here we use a set of 139 transcriptome-derived, unlinked nuclear single nucleotide polymorphisms (SNP) to assess the genetic structure of the Carpathian newt (Lissotriton montandoni, Lm) and introgression from its congener, the smooth newt (L. vulgaris, Lv). Two substantially differentiated groups of Lm populations likely originated from separate refugia, both located in the Eastern Carpathians. The colonization of the present range in north-western and south-western directions was accompanied by a modest loss of variation; admixture between the two groups has occurred in the middle of the Eastern Carpathians. Local, apparently recent introgression of Lv alleles into several Lm populations was detected, demonstrating increased power for admixture detection in comparison to a previous study based on a limited number of microsatellite markers. The level of introgression was higher in Lm populations classified as admixed than in syntopic populations. We discuss the possible causes and propose further tests to distinguish between alternatives. Several outlier loci were identified in tests of interspecific differentiation, suggesting genomic heterogeneity of gene flow between species.
Conflict of interest statement
Figures


Similar articles
-
No evidence for nuclear introgression despite complete mtDNA replacement in the Carpathian newt (Lissotriton montandoni).Mol Ecol. 2013 Apr;22(7):1884-903. doi: 10.1111/mec.12225. Epub 2013 Feb 4. Mol Ecol. 2013. PMID: 23379646
-
Divergence history of the Carpathian and smooth newts modelled in space and time.Mol Ecol. 2016 Aug;25(16):3912-28. doi: 10.1111/mec.13724. Epub 2016 Jul 9. Mol Ecol. 2016. PMID: 27288862
-
Differential introgression across newt hybrid zones: Evidence from replicated transects.Mol Ecol. 2019 Nov;28(21):4811-4824. doi: 10.1111/mec.15251. Epub 2019 Oct 20. Mol Ecol. 2019. PMID: 31549466
-
Interspecific hybridization increases MHC class II diversity in two sister species of newts.Mol Ecol. 2012 Feb;21(4):887-906. doi: 10.1111/j.1365-294X.2011.05347.x. Epub 2011 Nov 9. Mol Ecol. 2012. PMID: 22066802
-
Massive introgression of major histocompatibility complex (MHC) genes in newt hybrid zones.Mol Ecol. 2019 Nov;28(21):4798-4810. doi: 10.1111/mec.15254. Epub 2019 Oct 21. Mol Ecol. 2019. PMID: 31574568
Cited by
-
Linkage Map of Lissotriton Newts Provides Insight into the Genetic Basis of Reproductive Isolation.G3 (Bethesda). 2017 Jul 5;7(7):2115-2124. doi: 10.1534/g3.117.041178. G3 (Bethesda). 2017. PMID: 28500054 Free PMC article.
-
Balancing selection and introgression of newt immune-response genes.Proc Biol Sci. 2018 Aug 15;285(1884):20180819. doi: 10.1098/rspb.2018.0819. Proc Biol Sci. 2018. PMID: 30111606 Free PMC article.
-
Genomic heterogeneity of historical gene flow between two species of newts inferred from transcriptome data.Ecol Evol. 2016 Jun 9;6(13):4513-25. doi: 10.1002/ece3.2152. eCollection 2016 Jul. Ecol Evol. 2016. PMID: 27386093 Free PMC article.
-
North African hybrid sparrows (Passer domesticus, P. hispaniolensis) back from oblivion - ecological segregation and asymmetric mitochondrial introgression between parental species.Ecol Evol. 2016 Jun 28;6(15):5190-206. doi: 10.1002/ece3.2274. eCollection 2016 Aug. Ecol Evol. 2016. PMID: 27551376 Free PMC article.
-
Red Queen Processes Drive Positive Selection on Major Histocompatibility Complex (MHC) Genes.PLoS Comput Biol. 2015 Nov 24;11(11):e1004627. doi: 10.1371/journal.pcbi.1004627. eCollection 2015 Nov. PLoS Comput Biol. 2015. PMID: 26599213 Free PMC article.
References
-
- Slatkin M (1987) Gene flow and the geographic structure of natural populations. Science 236: 787–792. - PubMed
-
- Avise JC (2000) Phylogeography. The history and formation of species. Cambridge-London: Cambridge University Press.
-
- Manel S, Holderegger R (2013) Ten years of landscape genetics. Trends in Ecology and Evolution 28: 614–621. - PubMed
-
- Excoffier L, Foll M, Petit RJ (2009) Genetic consequences of range expansions. Annual Review of Ecology, Evolution, and Systematics 40: 481–501.
-
- Charlesworth B, Charlesworth D, Barton NH (2003) The Effects of Genetic and Geographic Structure on Neutral Variation. Annual Review of Ecology, Evolution, and Systematics 34: 99–125.
Publication types
MeSH terms
Substances
LinkOut - more resources
Full Text Sources
Other Literature Sources
Miscellaneous

