. 2014 May 13:4:4942.
doi: 10.1038/srep04942.

High-throughput profiling of influenza A virus hemagglutinin gene at single-nucleotide resolution

Affiliations

High-throughput profiling of influenza A virus hemagglutinin gene at single-nucleotide resolution

Nicholas C Wu et al. Sci Rep. .

Abstract

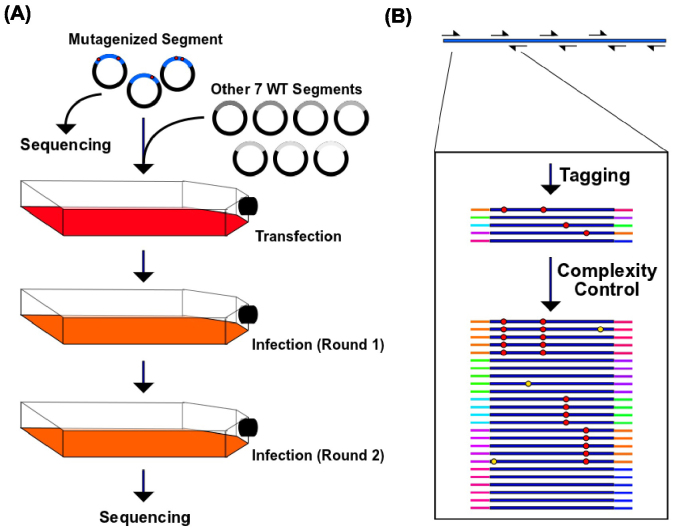
Genetic research on influenza virus biology has been informed in large part by nucleotide variants present in seasonal or pandemic samples, or individual mutants generated in the laboratory, leaving a substantial part of the genome uncharacterized. Here, we have developed a single-nucleotide resolution genetic approach to interrogate the fitness effect of point mutations in 98% of the amino acid positions in the influenza A virus hemagglutinin (HA) gene. Our HA fitness map provides a reference to identify indispensable regions to aid in drug and vaccine design as targeting these regions will increase the genetic barrier for the emergence of escape mutations. This study offers a new platform for studying genome dynamics, structure-function relationships, virus-host interactions, and can further rational drug and vaccine design. Our approach can also be applied to any virus that can be genetically manipulated.


Figures

Figure 1
Figure 1. Mutant library passaging and sequencing library preparation.
(A) The HA segment was randomized by error-prone PCR. The randomized segment with the remaining seven wild type segments were transfected into C227 cells to generate the viral mutant library. Two rounds of 24-hour infections were performed using A549 cells with an MOI of 0.05. Both the plasmid library and the passaged viral library were subjected to sequencing using the Illumina HiSeq 2000 machine. (B) The HA gene was divided into 12 amplicons for the first PCR. Unique tags were assigned to both ends of the individual molecules during the amplification process. The second PCR generated identical copies of individual molecules linked with unique tags. Red circles represent true mutations; Yellow circles represent sequencing errors.
Figure 2
Figure 2. Single-nucleotide resolution fitness profiling.
(A) The RF index for individual point mutations across the HA gene was computed. Log10 of the RF index is plotted on the y-axis. Each nucleotide position is represented by four consecutive lines for the RF indices that correspond to mutating to A (blue), T (green), C (orange), or G (red). The Log10 RF index of wild type (WT) nucleotides is set as zero. Only point mutations with a coverage of ≥ 30 tag-conflated reads in the plasmid library are shown. Otherwise, point mutations are plotted as a gray circle on the zero baseline. A short region is shown as an inset to demonstrate the resolution of our dataset. (B) The distributions of the log10 RF indices for silent substitutions, nonsense substitutions and missense substitutions are displayed as histograms. Mutations located at the 5′ terminal 200 bp and 3′ terminal 200 bp regions are not included in this analysis to avoid confounding by the vRNA packaging signal.
Figure 3
Figure 3. Experimental validation.
(A) The top panel displays the log10 TCID50 value of mutant virus rescued from transfection. The bottom panel represents their log10 RF indices from the biological duplicate. (B) A Pearson correlation of 0.9 is obtained between log10 TCID50 from transfection (x-axis) and log10 RF index (y-axis).
Figure 4
Figure 4. Structural analysis on hemagglutinin.
(A) All α-helices (orange, red, pink, cyan, green, yellow) and a non-structural loop (blue) in HA are highlighted. Mean log10 RF indices for individual highlighted structural elements are shown. (B) The log10 RF indices for all observed X → P mutations (where X can be any amino acids but P) in individual highlighted structural elements are plotted as stripcharts. The colors of the stripcharts match the highlight colors of the corresponding structural elements in panel A. The bottom stripchart represents the non-structural loop that undergoes α-helix formation during membrane fusion. (C) Helical wheel was constructed by DrawCoil 1.0 (http://www.grigoryanlab.org/drawcoil/). Amino acid property of each residue is color coded. Polar: orange; Hydrophobic: grey; Positively charged: red; Negatively charged: blue. (D) The bar chart represents the RF indices of all profiled amino acid substitutions at heptad position d. RF indices of silent mutations are also included for comparison.
Figure 5
Figure 5. Essential regions on hemagglutinin.
(A–B) The RF indices of the most destructive missense substitutions in the profiling data for individual amino acids are projected on the HA protein structure to identify essential regions intolerable to mutations. (C) The RF indices of the least destructive missense substitutions in the profiling data for individual amino acids are projected on the HA protein structure to identify essential regions intolerable to mutations. The inset represents the side chain interaction between HA (grey) and the proposed influenza universal antibody CR6261 (green) (PDB: 3GBN). Parentheses represent the residue naming according to HA2. The mean log10 RF indices of nonconservative mutations for each residue are shown. Note that, residue 389 is an aspartic acid in the structure but is an asparagine in our wild type HA sequence. A compatible rotamer for T392 was generated using PyMOL to display the hydrogen bond. All hydrogen bonds (black dotted lines) are displayed as described. (A–C) Red: RF index < 0.05; Orange: RF index < 0.1; Green: other. The structure is based on PDB: 1RUZ. (D) The RF indices for missense mutations within the universal antibody recognition sites are shown. Types of amino acid substitution are color coded with red: nonsense substitution; orange: nonconservative substitution; blue: conservative substitution; green: silent mutation. A conservative substitution is defined as having a positive score in the blosum80 matrix.

References

    1. Mardis E. R. Next-generation dna sequencing methods. Annu Rev Genomics Hum Genet 9, 387–402 (2008). - PubMed
    1. Schena M., Shalon D., Davis R. W. & Brown P. O. Quantitative monitoring of gene expression patterns with a complementary dna microarray. Science 270, 467–470 (1995). - PubMed
    1. Barski A. et al. High-resolution profiling of histone methylations in the human genome. Cell 129, 823–837 (2007). - PubMed
    1. Chen K. & Pachter L. Bioinformatics for whole-genome shotgun sequencing of microbial communities. PLoS Comput Biol 1, 106–112 (2005). - PMC - PubMed
    1. Mavromatis K. et al. The fast changing landscape of sequencing technologies and their impact on microbial genome assemblies and annotation. PLoS One 7, e48837 (2012). - PMC - PubMed

Publication types

MeSH terms

Substances