

Cortical activation to object shape and speed of motion during the first year
- PMID: 24821531
- PMCID: PMC4228933
- DOI: 10.1016/j.neuroimage.2014.04.082
Cortical activation to object shape and speed of motion during the first year
Abstract
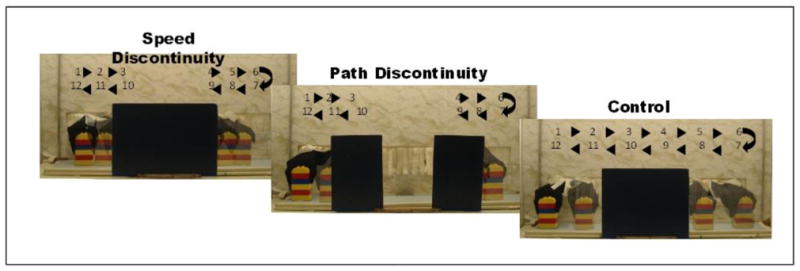
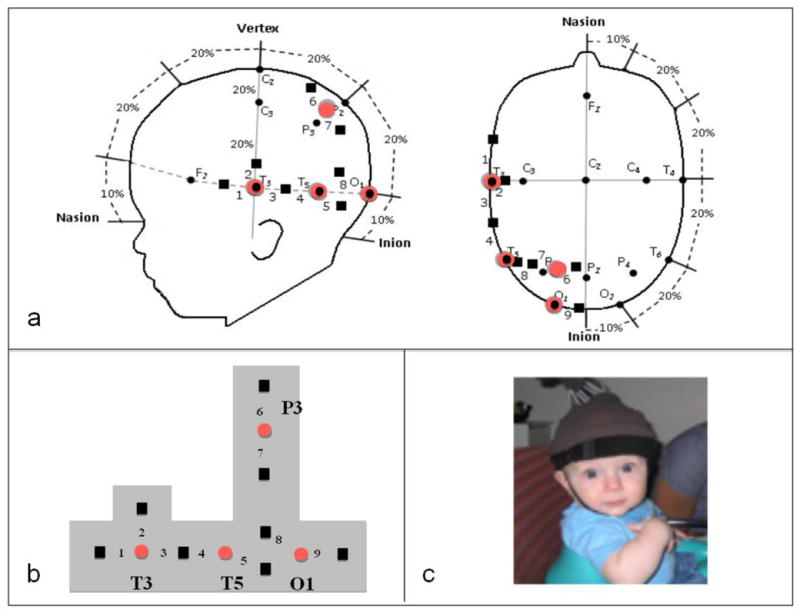
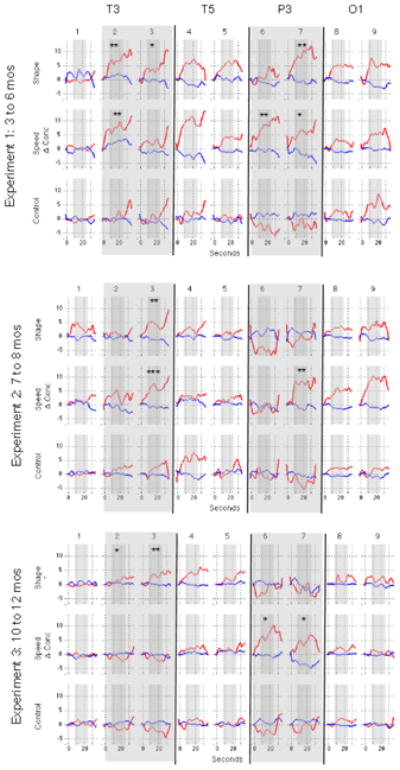
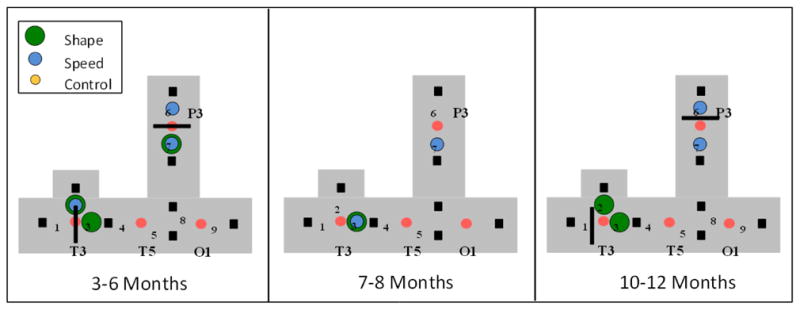
A great deal is known about the functional organization of cortical networks that mediate visual object processing in the adult. The current research is part of a growing effort to identify the functional maturation of these pathways in the developing brain. The current research used near-infrared spectroscopy to investigate functional activation of the infant cortex during the processing of featural information (shape) and spatiotemporal information (speed of motion) during the first year of life. Our investigation focused on two areas that were implicated in previous studies: anterior temporal cortex and posterior parietal cortex. Neuroimaging data were collected with 207 infants across three age groups: 3-6 months (Experiment 1), 7-8 months (Experiment 2), and 10-12 months (Experiments 3 and 4). The neuroimaging data revealed age-related changes in patterns of activation to shape and speed information, mostly involving posterior parietal areas, some of which were predicted and others that were not. We suggest that these changes reflect age-related differences in the perceptual and/or cognitive processes engaged during the task.
Keywords: Functional brain activation; Infants; Near-infrared spectroscopy; Object processing; Parietal cortex; Temporal cortex.
Copyright © 2014 Elsevier Inc. All rights reserved.
Figures


Similar articles
-
Functional Organization of the Temporal-Parietal Junction for Theory of Mind in Preverbal Infants: A Near-Infrared Spectroscopy Study.J Neurosci. 2018 May 2;38(18):4264-4274. doi: 10.1523/JNEUROSCI.0264-17.2018. Epub 2018 Mar 28. J Neurosci. 2018. PMID: 29593053 Free PMC article.
-
Dissociation of processing of featural and spatiotemporal information in the infant cortex.Neuroimage. 2010 Dec;53(4):1256-63. doi: 10.1016/j.neuroimage.2010.06.064. Epub 2010 Jul 13. Neuroimage. 2010. PMID: 20603218 Free PMC article.
-
A Generic Mechanism for Perceptual Organization in the Parietal Cortex.J Neurosci. 2018 Aug 8;38(32):7158-7169. doi: 10.1523/JNEUROSCI.0436-18.2018. Epub 2018 Jul 13. J Neurosci. 2018. PMID: 30006362 Free PMC article.
-
Perceptual and cognitive visual functions of parietal and temporal cortices in the cat.Cereb Cortex. 1996 Sep-Oct;6(5):673-95. doi: 10.1093/cercor/6.5.673. Cereb Cortex. 1996. PMID: 8921203 Review.
-
Neuronal correlates of motion-defined shape perception in primate dorsal and ventral streams.Eur J Neurosci. 2018 Nov;48(10):3171-3185. doi: 10.1111/ejn.14121. Epub 2018 Aug 31. Eur J Neurosci. 2018. PMID: 30118167 Review.
Cited by
-
Object processing in the infant: lessons from neuroscience.Trends Cogn Sci. 2015 Jul;19(7):406-13. doi: 10.1016/j.tics.2015.04.009. Epub 2015 May 22. Trends Cogn Sci. 2015. PMID: 26008625 Free PMC article. Review.
-
Infants can use temporary or scant categorical information to individuate objects.Cogn Psychol. 2024 Mar;149:101640. doi: 10.1016/j.cogpsych.2024.101640. Epub 2024 Feb 26. Cogn Psychol. 2024. PMID: 38412626 Free PMC article.
-
fNIRS: An Emergent Method to Document Functional Cortical Activity during Infant Movements.Front Psychol. 2016 Apr 20;7:533. doi: 10.3389/fpsyg.2016.00533. eCollection 2016. Front Psychol. 2016. PMID: 27148141 Free PMC article.
-
The use of functional near-infrared spectroscopy in tracking neurodevelopmental trajectories in infants and children with or without developmental disorders: a systematic review.Front Psychiatry. 2023 Sep 14;14:1210000. doi: 10.3389/fpsyt.2023.1210000. eCollection 2023. Front Psychiatry. 2023. PMID: 37779610 Free PMC article. Review.
-
Altered Corticomuscular Coherence (CMCoh) Pattern in the Upper Limb During Finger Movements After Stroke.Front Neurol. 2020 May 14;11:410. doi: 10.3389/fneur.2020.00410. eCollection 2020. Front Neurol. 2020. PMID: 32477257 Free PMC article.
References
-
- Arterberry ME, Craton LG, Yonas A. Infants’ sensitity to motion-carried information for depth and object properties. In: Granrud C, editor. Visual perception and cognition in infancy: Twenty-third Carnegie Mellon symposium on cognition. Hillsdale, NJ: Lawrence Erlbaum Associates; 1993.
-
- Baillargeon R, Li J, Gertner Y, Wu D. How do infants reason about physical events? In: Goswami U, editor. The Wiley-Blackwell handbook of childhood cognitive development. 2. Malden, MA: Wiley-Blackwell; 2011. pp. 11–48.
-
- Bartels A, Zeki S. The architecture of the colour centre in the human visual brain: New results and a review. European Journal of Neuroscience. 2000;12:172–193. - PubMed
Publication types
MeSH terms
Grants and funding
LinkOut - more resources
Full Text Sources
Other Literature Sources
