. 2014 May 27;111(21):7867-72.
doi: 10.1073/pnas.1402785111. Epub 2014 May 12.

Compressive mapping of number to space reflects dynamic encoding mechanisms, not static logarithmic transform

Affiliations

Compressive mapping of number to space reflects dynamic encoding mechanisms, not static logarithmic transform

Guido Marco Cicchini et al. Proc Natl Acad Sci U S A. .

Abstract

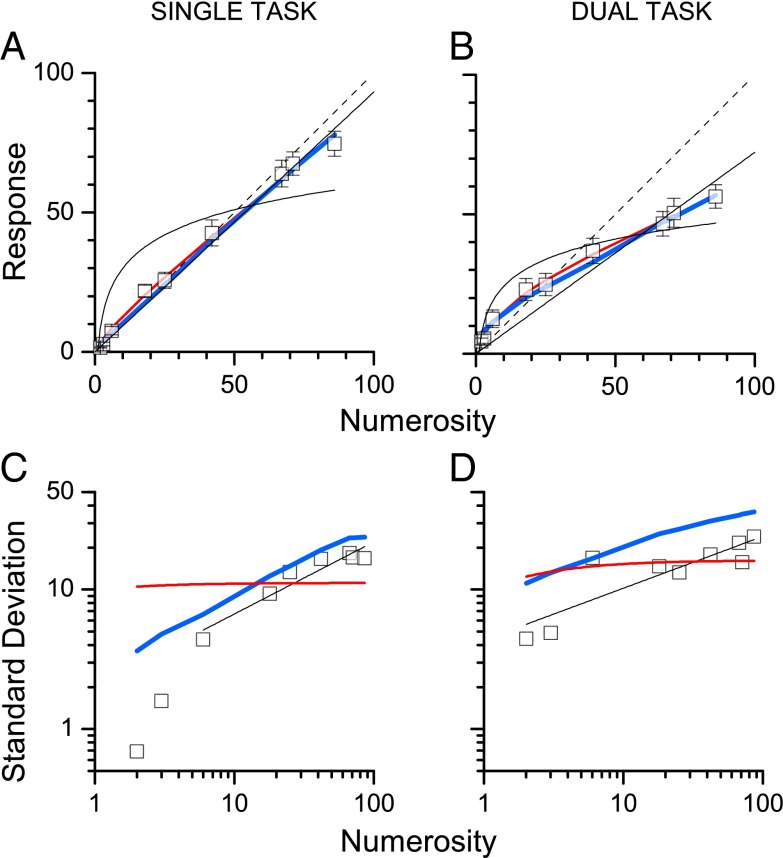
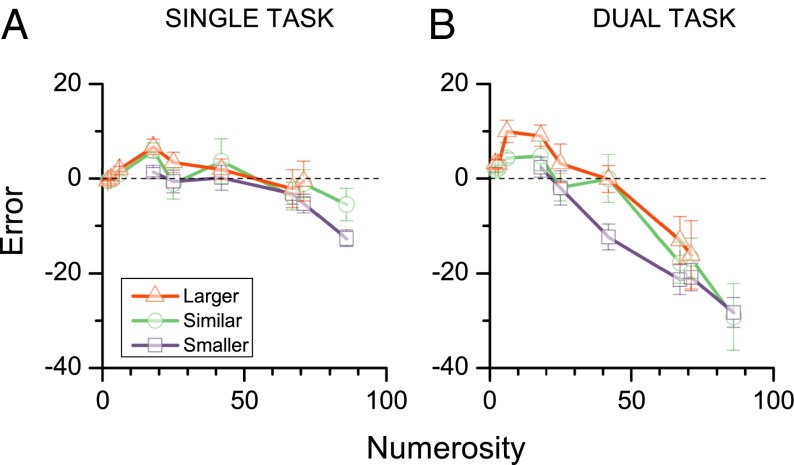
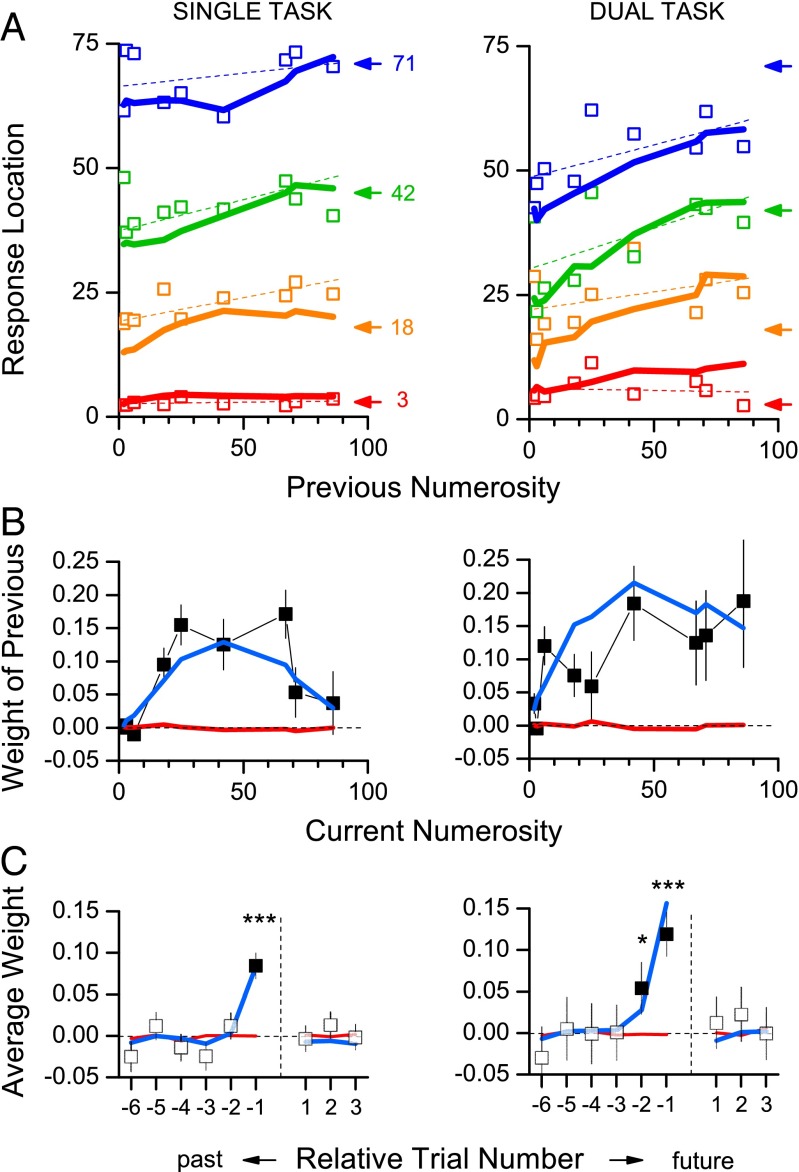
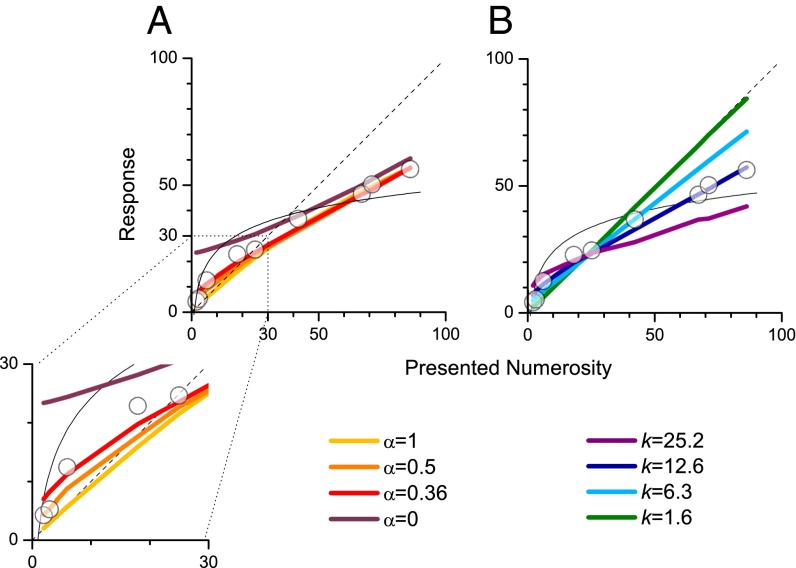
The mapping of number onto space is fundamental to measurement and mathematics. However, the mapping of young children, unschooled adults, and adults under attentional load shows strong compressive nonlinearities, thought to reflect intrinsic logarithmic encoding mechanisms, which are later "linearized" by education. Here we advance and test an alternative explanation: that the nonlinearity results from adaptive mechanisms incorporating the statistics of recent stimuli. This theory predicts that the response to the current trial should depend on the magnitude of the previous trial, whereas a static logarithmic nonlinearity predicts trialwise independence. We found a strong and highly significant relationship between numberline mapping of the current trial and the magnitude of the previous trial, in both adults and school children, with the current response influenced by up to 15% of the previous trial value. The dependency is sufficient to account for the shape of the numberline, without requiring logarithmic transform. We show that this dynamic strategy results in a reduction of reproduction error, and hence improvement in accuracy.

Keywords: Weber–Fechner law; approximate number system; numerical cognition; predictive coding; serial dependency.


Conflict of interest statement

The authors declare no conflict of interest.

Figures

Fig. 1.
Fig. 1.
Mapping number to space. The square black symbols show the average response location of subjects in the single-task (A) and dual-task (B) conditions. The thin black lines show the best-fitting linear and logarithmic models. The blue and red lines show, respectively, the best-fitting predictions for the Bayesian (Eq. 2) and log-linear models (Eq. 1). (C and D) SDs of responses as a function of number presented (on log axes). The thin black lines show the best-fitting linear regressions (outside the subitizing range), defining the index of the power law (α of Eq. 5), used for the modeling. The blue and red curves show, respectively, the predicted SDs from the Bayesian and log-linear models. Goodness of fit was assessed by the coefficient of determination (R2) and the Akaike information criterion (AIC), which takes into account degrees of freedom (45). The values of R2 and AIC (respectively) for the log-linear model were 0.79 and 16.4 (single) and 0.94 and 27.0 (double). For the Bayesian model they were 0.72 and 17.0 (single) and 0.97 and 16.7 (double). Smaller AIC values denote better fits, with differences of 2 considered negligible.
Fig. 2.
Fig. 2.
The effect of previous stimulus magnitude. (A and B) Average response error (difference between response and stimulus magnitude) for trials parsed into three categories based on the magnitude of the previous stimulus: purple, previous stimulus at least seven numbers less; green, previous stimulus within seven of the current one; red, previous stimulus at least seven higher. The magnitude of the previous stimulus had a clear effect, particularly in the dual-task condition, and was statistically significant in both conditions.
Fig. 3.
Fig. 3.
Predicted and measured serial dependencies. (A) Response as a function of numerosity of the previous trial for single-task (Left) and dual-task (Right) conditions for the experiment data (□), together with the predictions from the Bayesian integration model of Eq. 2 (heavy color-coded lines), for the four representative numerosities. Values of k are 2.75 for the single-task condition and 12.6 for the dual-task. The thin straight lines show best-fitting linear regressions to the data. The arrows show the veridical responses. (B) Average dependency (weight) on previous stimuli, as a function of current numerosity, given by the slope of regression lines such as those above. The thick lines show the predicted weights for the log-linear (Eq. 1, red) and Bayesian (blue) models. The black symbols show the correlations in the data for the three datasets. The error bars mark ±1 SEM. (C) Average weights as a function past and future trial number, for the data (open squares) and the two model predictions (Bayesian integration blue, log-linear red). Asterisks indicate significance from zero: ***P < 10−5, *P < 0.05, one-tailed bootstrap sign test.
Fig. 4.
Fig. 4.
Predictions of the Bayesian model. (A) Predicted numberlines for various power-law noise functions (Eq. 5), for α ranging from 0 (constant noise) to 1. All values predict a negatively accelerating numberline, with the main effect of varying α visible at low numerosities (Inset): Low α causes greater deviation from veridicality at these low numerosities. The value of k was chosen to best fit the data of the dual-task condition (k = 12.6). (B) The effect of varying the noise level k (for α = 0.36, the level best-fitting from the dual-task data). Increasing k causes greater deviations for veridicality.
Fig. 5.
Fig. 5.
The effect of the Bayesian integration model on error. (A) Predictions of how error increases with noise for a memoryless system (red) and the Bayesian integration model (blue). The Bayesian model predicts less error, with the difference increasing as the noisiness of the system increases. The symbols indicate k = 12.6, the level that best fit the dual-task data. (B) The abscissa shows the bias (average deviation from veridicality) and the ordinate the precision (SD of the scatter of responses around their mean) for the dual-task adult data. Each data point refers to a different numerosity. The red curve shows the prediction of a memoryless linear model and the blue curve that of the Bayesian model (Eq. 2). The black symbols show the data. The Bayesian model captures the pattern of the data: Both the model and the data show less total error (distance from origin) than the memoryless model.

References

    1. Galton F. Visualized numerals. Nature. 1880;21:252–256. 494-255.
    1. Dehaene S. The Number Sense: How the Mind Creates Mathematics. Oxford: Oxford Univ Press; 1997.
    1. Siegler RS, Booth JL. Development of numerical estimation in young children. Child Dev. 2004;75(2):428–444. - PubMed
    1. Dehaene S, Izard V, Spelke E, Pica P. Log or linear? Distinct intuitions of the number scale in Western and Amazonian indigene cultures. Science. 2008;320(5880):1217–1220. - PMC - PubMed
    1. Siegler RS, Opfer JE. The development of numerical estimation: Evidence for multiple representations of numerical quantity. Psychol Sci. 2003;14(3):237–243. - PubMed

Publication types

LinkOut - more resources