. 2014 May 27;111(21):E2219-28.
doi: 10.1073/pnas.1400958111. Epub 2014 May 12.

Mechanistic rationale for targeting the unfolded protein response in pre-B acute lymphoblastic leukemia

Affiliations

Mechanistic rationale for targeting the unfolded protein response in pre-B acute lymphoblastic leukemia

Behzad Kharabi Masouleh et al. Proc Natl Acad Sci U S A. .

Abstract

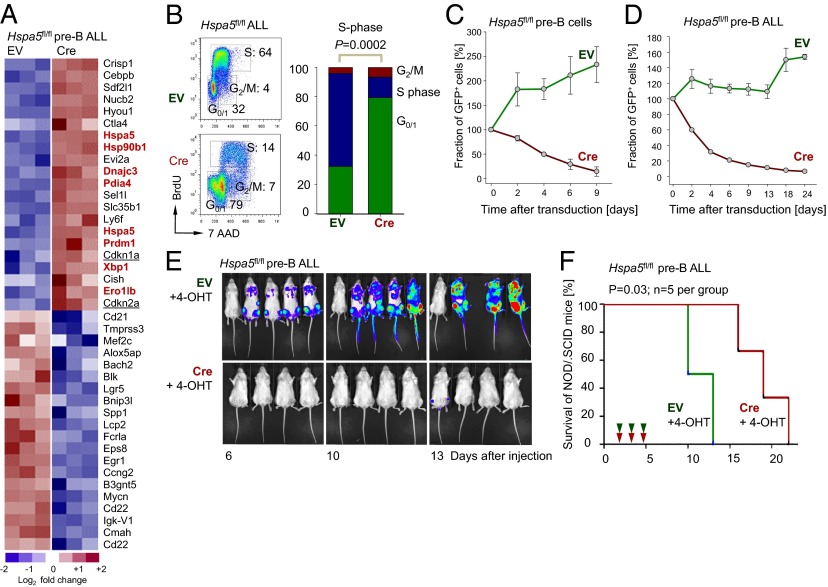
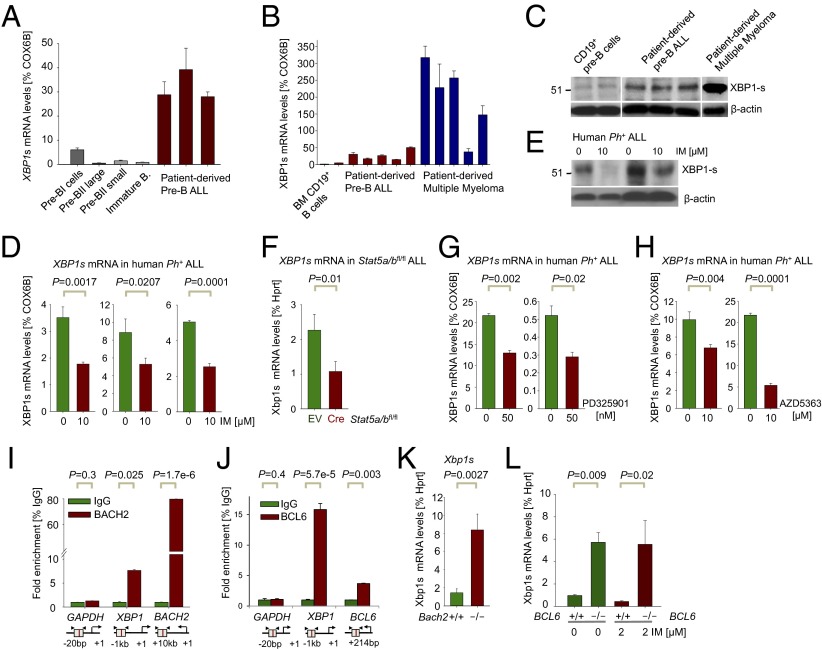
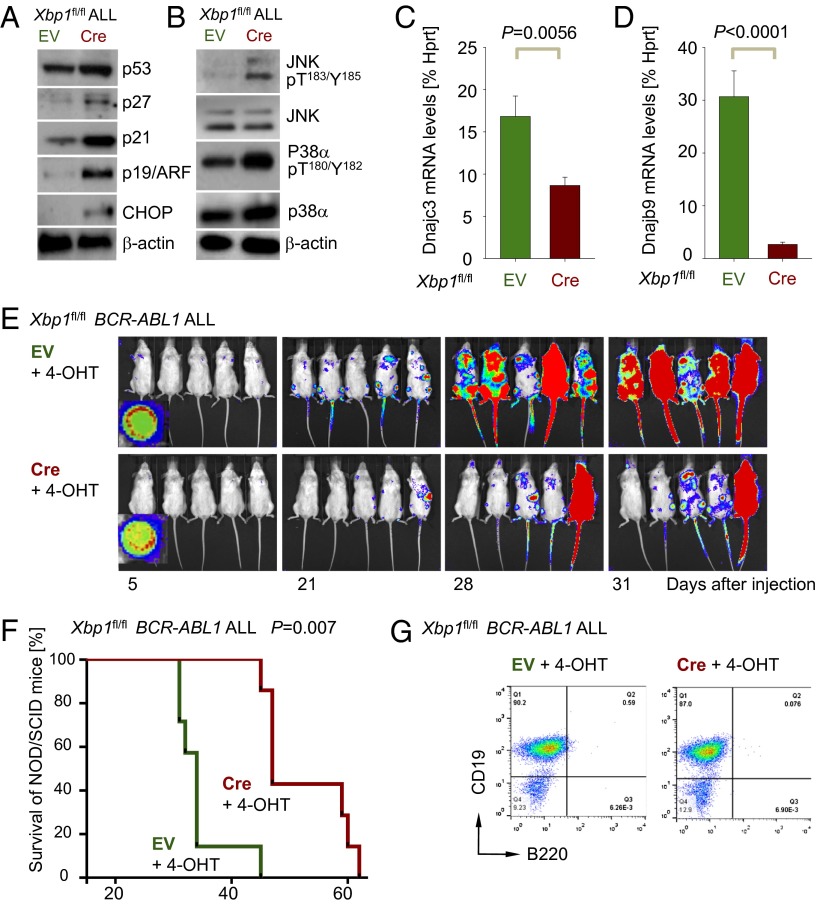
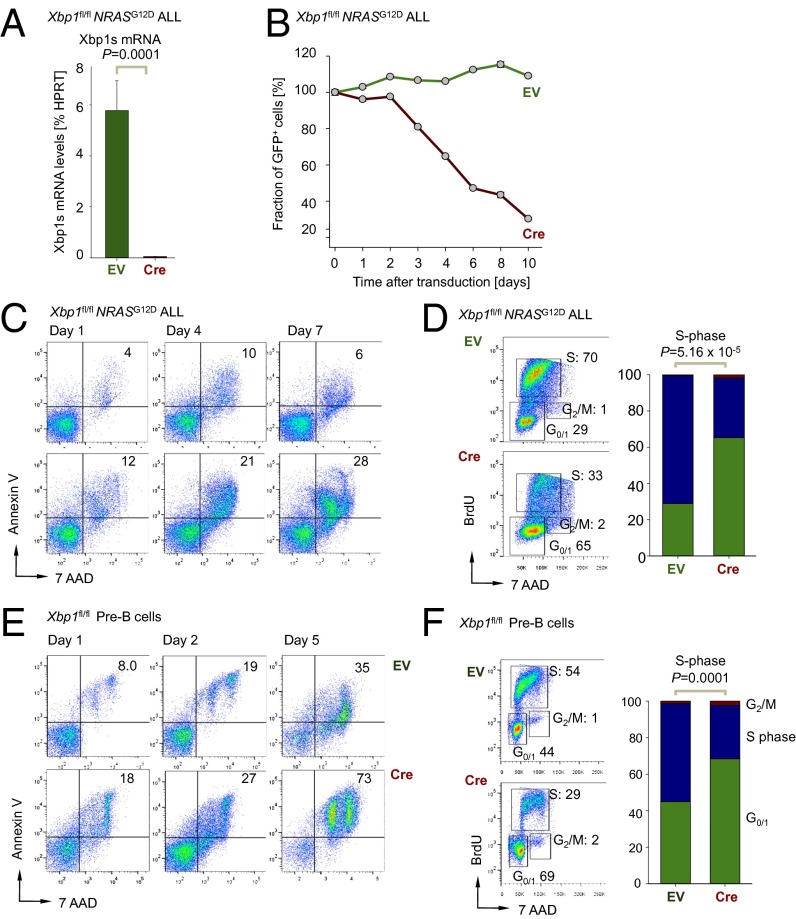
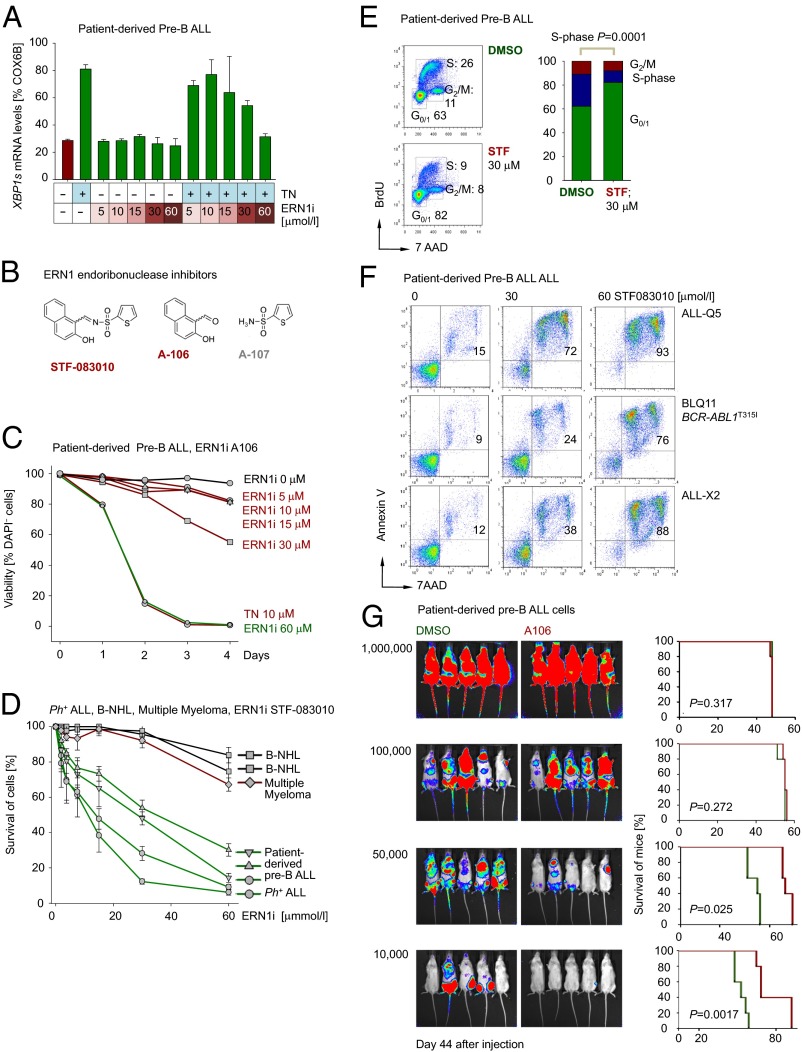
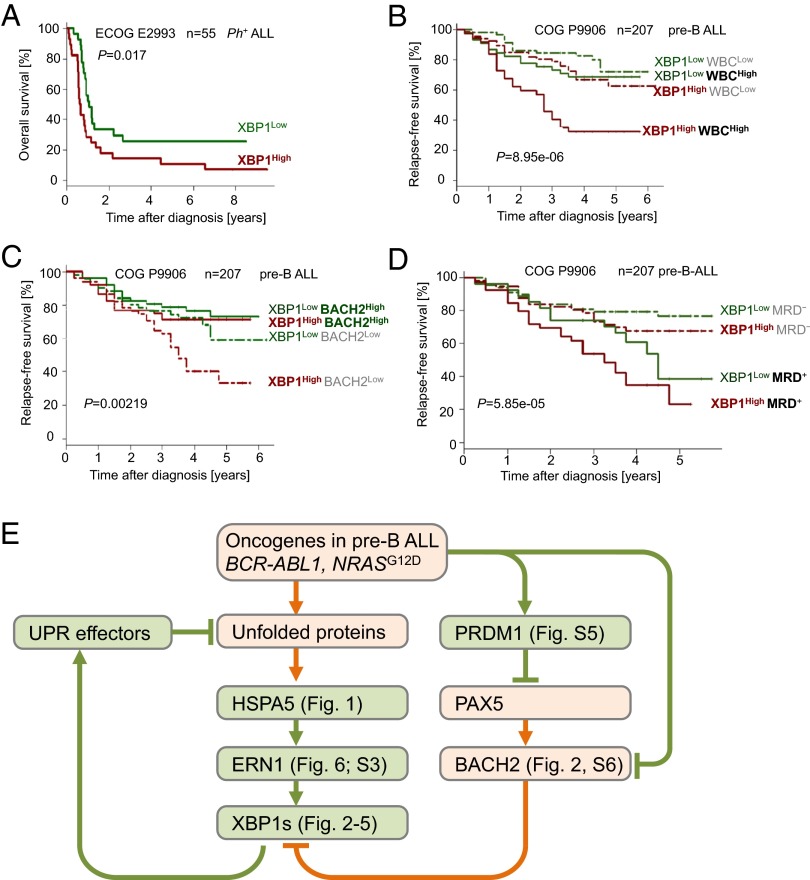
The unfolded protein response (UPR) pathway, a stress-induced signaling cascade emanating from the endoplasmic reticulum (ER), regulates the expression and activity of molecules including BiP (HSPA5), IRE1 (ERN1), Blimp-1 (PRDM1), and X-box binding protein 1 (XBP1). These molecules are required for terminal differentiation of B cells into plasma cells and expressed at high levels in plasma cell-derived multiple myeloma. Although these molecules have no known role at early stages of B-cell development, here we show that their expression transiently peaks at the pre-B-cell receptor checkpoint. Inducible, Cre-mediated deletion of Hspa5, Prdm1, and Xbp1 consistently induces cellular stress and cell death in normal pre-B cells and in pre-B-cell acute lymphoblastic leukemia (ALL) driven by BCR-ABL1- and NRAS(G12D) oncogenes. Mechanistically, expression and activity of the UPR downstream effector XBP1 is regulated positively by STAT5 and negatively by the B-cell-specific transcriptional repressors BACH2 and BCL6. In two clinical trials for children and adults with ALL, high XBP1 mRNA levels at the time of diagnosis predicted poor outcome. A small molecule inhibitor of ERN1-mediated XBP1 activation induced selective cell death of patient-derived pre-B ALL cells in vitro and significantly prolonged survival of transplant recipient mice in vivo. Collectively, these studies reveal that pre-B ALL cells are uniquely vulnerable to ER stress and identify the UPR pathway and its downstream effector XBP1 as novel therapeutic targets to overcome drug resistance in pre-B ALL.


Conflict of interest statement

The authors declare no conflict of interest.

Figures

Fig. 1.
Fig. 1.
Hspa5 (Ig heavy-chain binding protein) is required for the survival and malignant transformation of pre-B cells. (A) Gene expression profiling was assessed in Hspa5fl/fl pre-B ALL cells transduced with EV control and 4-OHT–inducible retroviral Cre (Cre) after 2 d of 4-OHT treatment. Highlighted are ER-related molecules such as Hsp90b1, Dnajc3, Pdia4, and Ero1lb as well as Prdm1 and Xbp1 in red and cell-cycle checkpoint regulators such as Arf (Cdkn2a) and p21 (Cdkn1a) (GEO accession no. GSE53684). (B) Hspa5fl/fl ALL cells with EV and Cre were stained with BrdU and 7AAD and the percentages of cells in the G0/1, S, and G2/M cell cycles are indicated after 1 d of 4-OHT treatment and shown in bar graph (n = 3). (C) Hspa5fl/fl pre-B cells were transduced with MSCV-GFP (EV) and Cre-GFP (Cre) and the relative fraction of GFP+ cells was measured up to 9 d (n = 3). (D) Similarly, the relative fraction of GFP+ cells in Hspa5fl/fl pre-B ALL cells with EV and Cre was measured up to 24 d (n = 3). (E) One million luciferase-labeled Hspa5fl/fl pre-B ALL cells carrying either tamoxifen-inducible GFP-tagged Cre (CreGFP) or a GFP-tagged empty vector control (EVGFP) were injected (i.v.) into sublethally irradiated (2 Gy) NOD/SCID mice and leukemic expansion was tracked by luciferase bioimaging. (F) The overall survival of transplant recipient mice is shown in a Kaplan–Meier analysis (n = 5 per group, P = 0.03).
Fig. 2.
Fig. 2.
Regulation of XBP1 by STAT5, ERK, and AKT (positive) and BACH2 and BCL6 (negative) in Ph+ ALL. (A) XBP1-s mRNA levels were measured by qRT-PCR in sorted B-cell fractions from healthy human donors compared with patient-derived pre-B ALL cells (ALL-Q5, ALL-O2, ALL-X2, BLQ11, and LAX9; n = 3) and (B) in two CD19+ MACS-enriched pre–B-cell samples and five patient-derived multiple myeloma samples (MM1–5; n = 3). (C) Western blot analysis of spliced XBP1-s for MACS-enriched normal human CD19+ pre-B cells compared with patient-derived pre-B ALL cells (as in B) and one patient-derived multiple myeloma (MM6) sample using β-actin as loading control. (D) XBP1-s mRNA levels were measured in Ph+ ALL cell lines (NALM1, TOM1, and BV173) treated with or without the TKI IM for 16 h (10 µM IM) by qRT-PCR (n = 3). (E) Protein levels of XBP1-s were measured by Western blot analysis in patient-derived Ph+ ALL cases (LAX9 and PDX59) treated with IM for 16 h (10 µM IM) using β-actin as loading control. (F) Xbp1-s mRNA levels were measured in Stat5a/bfl/fl ALL cells with EV control and 4-OHT–inducible Cre (Cre) after 24 h by qRT-PCR. (G and H) XBP1-s mRNA levels were measured in patient-derived pre-B ALL cases (PDX2 and LAX7R) treated with or without PD325901 or AZD5363 for 5 h (50 nM PD325901; 10 µM AZD5363) by qRT-PCR (n = 3). (I) Quantitative ChIP validation of BACH2 binding to the XBP1 promoter in a human Ph+ ALL patient sample (ICN1), GAPDH as a negative and BACH2 as a positive control.(J) Quantitative ChIP validation of BCL6 binding to the XBP1 promoter in human pre-B ALL cells. (K) XBP1 expression was assessed in Bach2−/− ALL cells compared with WT controls (Bach2+/+) by qRT-PCR using specific primers for spliced Xbp1-s (n = 3). (L) Xbp1s mRNA levels were measured by qRT-PCR in Bcl6−/− ALL cells compared with WT controls (Bcl6+/+) treated either with or without the TKI IM for 16 h (2 µM IM).
Fig. 3.
Fig. 3.
Inducible ablation of Xbp1 causes cell-cycle arrest and apoptosis in transformed pre-B cells. (A) Genomic deletion of Xbp1 was verified using specific primers to amplify floxed alleles in Xbp1fl/fl ALL cells transduced with EV control or 4-OHT–inducible Cre (Cre) after in vitro deletion or in vivo (three mice after treatment with 4-OHT) WT and H2O controls. (B) Gene expression profiling of Cre-mediated deletion of Xbp1- or Hspa5-deletion in BCR-ABL1–transformed Xbp1fl/+ or Hspa5fl/fl pre-B ALL cells. Highlighted are molecules related to the secretory and Golgi apparatus (Sirpa, B3gnt5, Cst7, Gldc, Hs3st2, and Slc16a3,underlined), Ig light chains and the early B-cell antigens Enpep and Cd22 (highlighted in blue) and ER chaperons (Hsp90b1, Derl3 and Atf6, highlighed in red; GEO accession nos. GSE53683 and GE53684). (C) Apoptosis was measured by Annexin-V and 7AAD staining in Xbp1fl/fl ALL cells with EV or Cre after 1 and 2 d 4-OHT treatment (n = 3). (D) Xbp1fl/fl ALL cells with EV or Cre were stained with BrdU and 7AAD and the percentages of cells in the G0/1, S, and G2/M cell cycles are indicated after 24 h of 4-OHT treatment and shown in bar graph (n = 3). (E) Xbp1fl/fl ALL cells with EV or Cre were stained with ER tracker green after 24 h of 4-OHT treatment (n = 3). (F) Xbp1fl/fl ALL cells with EV or Cre were stained in a senescence-associated β-galactosidase assay after 24 h of 4-OHT treatment and percentages of positively senescent cells are indicated and shown in bar graph (n = 3).
Fig. 4.
Fig. 4.
Loss of Xbp1 function activates proapoptotic pathways and prolongs survival of BCR-ABL1 pre-B ALL transplant recipient mice. (A) Protein levels of Arf (Cdkn2a), p53, p21 (Cdkn1a), p27 (Cdkn1b), and Chop were studied by Western blot analysis in Xbp1fl/fl ALL cells with (Cre) or without (EV) deletion of Xbp1 using β-actin as loading control (n = 3). (B) Likewise, phosphorylation of MAP kinases p38α (T180/Y182) and JNK1/2 (T183/Y185) were assessed (n = 3). (C and D) mRNA levels of DnajC3 (p58IPK) and DnajB9 (Erdj4) were measured in Xbp1fl/fl ALL cells with (Cre) or without (EV) deletion of Xbp1 by qRT-PCR (n = 3). (E) One million luciferase-labeled Xbp1fl/fl ALL cells with EV or Cre were injected (i.v.) into sublethally irradiated (2.5 Gy) NOD/SCID mice and leukemic expansion was tracked by luciferase bioimaging. (F) Overall survival of transplant recipient mice is shown in a Kaplan–Meier analysis (n = 7 per group). (G) A representative FACS analysis for surface markers CD19 and B220 (n = 4) is shown for Xbp1fl/fl ALL cells isolated from killed mice.
Fig. 5.
Fig. 5.
Xbp1 function is critical for the survival and proliferation of normal and NRASG12D transformed pre-B cells. (A) Xbp1 mRNA levels were measured in Xbp1fl/fl NRASG12D ALL cells transduced with EV control or 4-OHT–inducible retroviral Cre (Cre) after 48 h of 4-OHT treatment by qRT-PCR (n = 3). (B) Xbp1fl/fl NRASG12D ALL were transduced with GFP-tagged EV control or 4-OHT–inducible GFP-tagged Cre (Cre) and the relative fraction of GFP+ cells was measured (n = 3). (C) Apoptosis was assessed by Annexin-V and 7AAD staining in Xbp1fl/fl NRASG12D ALL cells with EV and Cre after 1, 4, and 7 d of treatment with 4-OHT (n = 3). (D) Xbp1fl/fl NRASG12D ALL cells with EV and Cre were stained with BrdU and 7AAD and the percentages of cells in the G0/1, S, and G2/M cell cycles are indicated after 5 d of 4-OHT treatment and shown in a bar graph (n = 3). (E) Apoptosis was assessed by Annexin-V and 7AAD FACS staining in IL-7–dependent Xbp1fl/fl pre-B cells with (Cre) or without (EV) deletion of Xbp1 after 1, 2, and 5 d of treatment with 4-OHT (n = 3). (F) IL-7–dependent Xbp1fl/fl pre-B cells with EV and Cre were stained with BrdU and 7AAD and the percentages of cells in the G0/1, S, and G2/M cell cycles are indicated after 5 d of 4-OHT treatment and shown in bar graph (n = 3).
Fig. 6.
Fig. 6.
Efficacy of pharmacological inhibition of XBP1 activation on patient-derived pre-B ALL cells in vitro and in vivo. (A) Patient-derived pre-B ALL cells (ALL-Q5) were treated with either the ER-stress inducer TN (10 µg) to activate XBP1 splicing (XBP1-s) alone, increasing concentrations of the ERN1 inhibitor STF-083010 (0–60 µM; ERN1i), or in combination for 24 h and mRNA levels of XBP1-s were measured by qRT-PCR (n = 3). (B) Chemical structures of the STF-083010 or its two hydrolysis products, A106 and A107, are shown. (C) Patient-derived pre-B ALL (ALL-Q5) were treated with A106 (0–60 µM) and TN (10 µg) and viability was assessed by DAPI staining up to 4 d and relative cell viability is shown (n = 3). (D) Patient-derived pre-B ALL (ALL-O2, ALL-Q5, and ALL-X2), Ph+ ALL (ICN1), B-cell non-Hodgkin lymphoma (B-NHL; JEKO1 and TOLEDO) or multiple myeloma (JJN3) cells were treated with STF-083010 (0–60 µM) and the relative viability was assessed by CCK-8 assay. (E) Patient-derived pre-B ALL cells (ALL-Q5) were stained with BrdU and 7AAD and the percentages of cells in G0/1, S, and G2/M cell cycle phases are indicated after 24 h of treatment with STF-083010 (30 µM) and shown in bar graph (n = 3). (F) Apoptosis was assessed by Annexin-V and 7AAD staining in patient-derived pre-B ALL cells (ALL-Q5, BLQ11, and ALL-X2) after 3 d of treatment with STF-083010 at two concentrations (30 and 60 µM; n = 3). (G) Patient-derived pre-B ALL cells (ALL-Q5) were treated for 24 h with A106 (30 µM) or DMSO control, labeled with firefly luciferase, and injected (i.v.) into sublethally irradiated (2.5 Gy) NOD/SCID mice at different dose levels (106, 105, 50,000, and 10,000 cells per mouse) and leukemic expansion was tracked by luciferase bioimaging. The overall survival of transplant recipient mice is shown in a Kaplan–Meier analysis (n = 5 per group).
Fig. 7.
Fig. 7.
XBP1 expression and activity is a predictor of poor clinical outcome and a therapeutic target in pre-B ALL. (A) In an analysis, Ph+ ALL patients (ECOG E2993, n = 55, log rank test P = 0.017) were segregated into two groups based on high or low mRNA levels in respect to the median mRNA value of the XBP1 probeset and the overall survival was assessed. (B) In a multivariate analysis, pre-B ALL patients (COG clinical trial P9906, n = 207) were segregated into four groups based on high or low mRNA levels of XBP1 (higher or lower than median mRNA levels of XBP1) and WBC counts, (C) mRNA levels of BACH2 (27), or (D) minimal residual disease (MRD) status. (E) A schematic overview summarizing the key findings of this study.

Similar articles

Cited by

References

    1. Hetz C, Glimcher LH. Fine-tuning of the unfolded protein response: Assembling the IRE1alpha interactome. Mol Cell. 2009;35(5):551–561. - PMC - PubMed
    1. Shaffer AL, et al. Blimp-1 orchestrates plasma cell differentiation by extinguishing the mature B cell gene expression program. Immunity. 2002;17(1):51–62. - PubMed
    1. Shaffer AL, et al. XBP1, downstream of Blimp-1, expands the secretory apparatus and other organelles, and increases protein synthesis in plasma cell differentiation. Immunity. 2004;21(1):81–93. - PubMed
    1. Hetz C. The unfolded protein response: Controlling cell fate decisions under ER stress and beyond. Nat Rev Mol Cell Biol. 2012;13(2):89–102. - PubMed
    1. Harding HP, et al. An integrated stress response regulates amino acid metabolism and resistance to oxidative stress. Mol Cell. 2003;11(3):619–633. - PubMed

Publication types

MeSH terms

Substances