. 2014 May 20;111(20):7176-84.
doi: 10.1073/pnas.1319946111. Epub 2014 May 12.

Use (and abuse) of expert elicitation in support of decision making for public policy

Affiliations

Use (and abuse) of expert elicitation in support of decision making for public policy

M Granger Morgan. Proc Natl Acad Sci U S A. .

Abstract

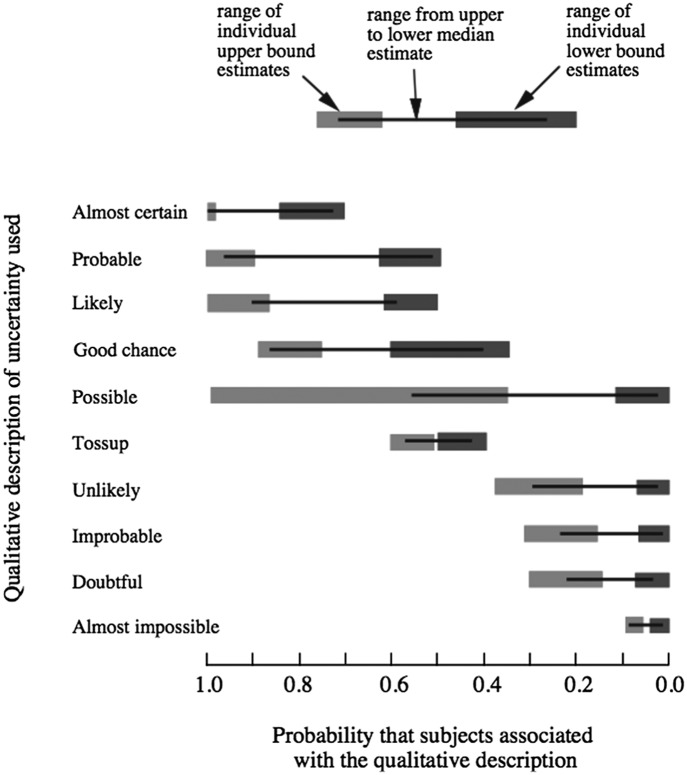
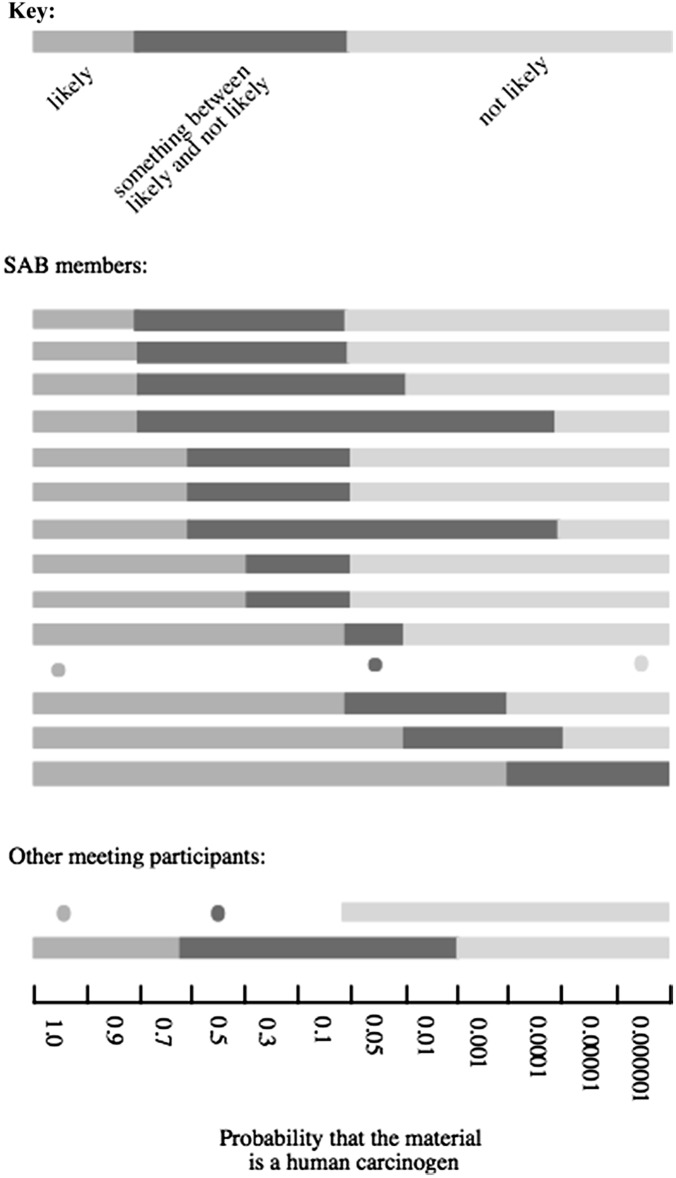
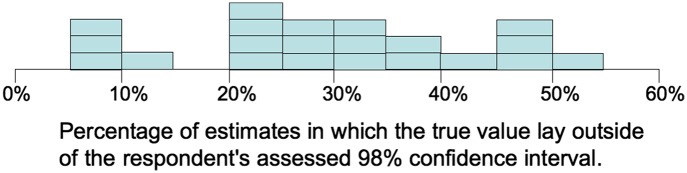
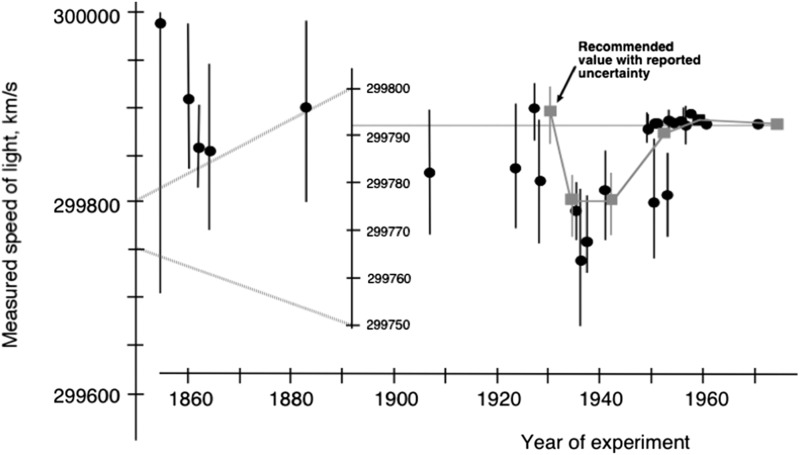
The elicitation of scientific and technical judgments from experts, in the form of subjective probability distributions, can be a valuable addition to other forms of evidence in support of public policy decision making. This paper explores when it is sensible to perform such elicitation and how that can best be done. A number of key issues are discussed, including topics on which there are, and are not, experts who have knowledge that provides a basis for making informed predictive judgments; the inadequacy of only using qualitative uncertainty language; the role of cognitive heuristics and of overconfidence; the choice of experts; the development, refinement, and iterative testing of elicitation protocols that are designed to help experts to consider systematically all relevant knowledge when they make their judgments; the treatment of uncertainty about model functional form; diversity of expert opinion; and when it does or does not make sense to combine judgments from different experts. Although it may be tempting to view expert elicitation as a low-cost, low-effort alternative to conducting serious research and analysis, it is neither. Rather, expert elicitation should build on and use the best available research and analysis and be undertaken only when, given those, the state of knowledge will remain insufficient to support timely informed assessment and decision making.


Conflict of interest statement

The author declares no conflict of interest.

Figures

Fig. 1.
Fig. 1.
The range of numerical probabilities that respondents attached to qualitative probability words in the absence of any specific context are shown. Note the very wide ranges of probability that were associated with some of these words. Figure redrawn from Wallsten et al. (30).
Fig. 2.
Fig. 2.
Results obtained by Morgan (32) when members of the Executive Committee of the EPA Science Advisory Board were asked to assign numerical probabilities to uncertainty words that had been proposed for use with EPA cancer guidelines (33). Note that even in this relatively small and expert group, the minimum probability associated with the word “likely” spans 4 orders of magnitude, the maximum probability associated with the word “not likely” spans more than 5 orders of magnitude, and there is an overlap of the probabilities the different experts associated with the two words.
Fig. 3.
Fig. 3.
Summary of the value of the surprise index (ideal value = 2%) observed in 21 different studies involving over 10,000 assessment questions. These results indicate clearly the ubiquitous tendency to overconfidence (i.e., assessed probability distributions that are too narrow). A more detailed summary is provided in Morgan and Henrion (39).
Fig. 4.
Fig. 4.
Published estimates of the speed of light. The light gray boxes that start in 1930 are the recommended values from the particle physics group that presumably include an effort to consider uncertainty arising from systematic error (40). Note that for over two decades the reported confidence intervals on these recommended values did not include the present best-measured value. Henrion and Fischhoff (40), from which this figure is combined and redrawn, report that the same overconfidence is observed in the recommended values of a number of other physical constants.
Fig. 5.
Fig. 5.
Illustration of two extremes in expert calibration. (A) Assessment of probability of pneumonia (based on observed symptoms) in 1,531 first-time patients by nine physicians compared with radiographically assigned cases of pneumonia as reported by Christensen-Szalanski and Bushyhead (44). (B) Once-daily US Weather Service precipitation forecasts for 87 stations are compared with actual occurrence of precipitation (April 1977 to March 1979) as reported by Charba and Klein (43). The small numbers adjacent to each point report the number of forecasts.
Fig. 6.
Fig. 6.
Comparison of individually assessed value of total radiative forcing produced by aerosols (15) (Left) with the summary assessment produced by the fourth IPCC assessment (66) (Right). Note that many of the individual assessments reported in Left involve a wider range of uncertainty than IPCC consensus summary. The summary that was provided in the third assessment (67) included only a portion of the indirect effects and the range was narrower.
Fig. 7.
Fig. 7.
Individual expert assessments of the value of climate sensitivity as reported in Zickfeld et al. (16) compared with the IPCC assessment by Schneider et al. (68) that there is between an 0.05 and 0.17 probability that climate sensitivity is >4.5 °C (i.e., above the red line). The assessed expert distributions place probability of between 0.07 and 0.37 above 4.5 °C.
Fig. 8.
Fig. 8.
Expert elicitation can be effective in displaying the range of opinions that exist within a scientific community. This plot displays clearly the two very different schools of thought that existed roughly a decade ago within the community of oceanographers about the probability “that a collapse of the AMOC will occur or will be irreversibly triggered as a function of the global mean temperature increase realized in the year 2100.” Each curve shows the subjective judgments of one of 12 experts. Four experts (2, 3, 4, and 7 in red) foresaw a high probability of collapse, while seven experts (in red) foresaw little, if any, likelihood of collapse. Collapse was defined as a reduction in AMOC strength by more than 90% relative to present day. Figure redrawn from Zickfeld et al. (18).

Comment in

  • Delphi: Somewhere between Scylla and Charybdis?
    Bolger F, Rowe G. Bolger F, et al. Proc Natl Acad Sci U S A. 2014 Oct 14;111(41):E4284. doi: 10.1073/pnas.1415425111. Epub 2014 Sep 19. Proc Natl Acad Sci U S A. 2014. PMID: 25239235 Free PMC article. No abstract available.

References

    1. Spetzler CS, Staël von Holstein C-AS. Probability encoding in decision analysis. Manage Sci. 1975;22(3):340–358.
    1. Garthwaite PH, Kadane JB, O’Hagan A. Statistical methods for eliciting probability distributions. J Am Stat Assoc. 2005;100(470):680–700.
    1. O’Hagan A, et al. Uncertain Judgments: Eliciting Experts’ Probabilities. Hoboken, NJ: John Wiley & Sons; 2006. 321 pp.
    1. Hora SC. In: Advances in Decision Analysis: From Foundations to Applications. Edwards W, Miles RF Jr, von Winterfeldt D, editors. New York: Cambridge Univ Press; 2007. pp. 129–153.
    1. DeGroot MH. Optimal Statistical Decisions. New York: McGraw-Hill; 1970. 489 pp.

Publication types

Substances

LinkOut - more resources