. 2014 May 27;111(21):7531-6.
doi: 10.1073/pnas.1402393111. Epub 2014 May 12.

In vivo modulation of hypoxia-inducible signaling by topographical helix mimetics

Affiliations

In vivo modulation of hypoxia-inducible signaling by topographical helix mimetics

Brooke Bullock Lao et al. Proc Natl Acad Sci U S A. .

Abstract

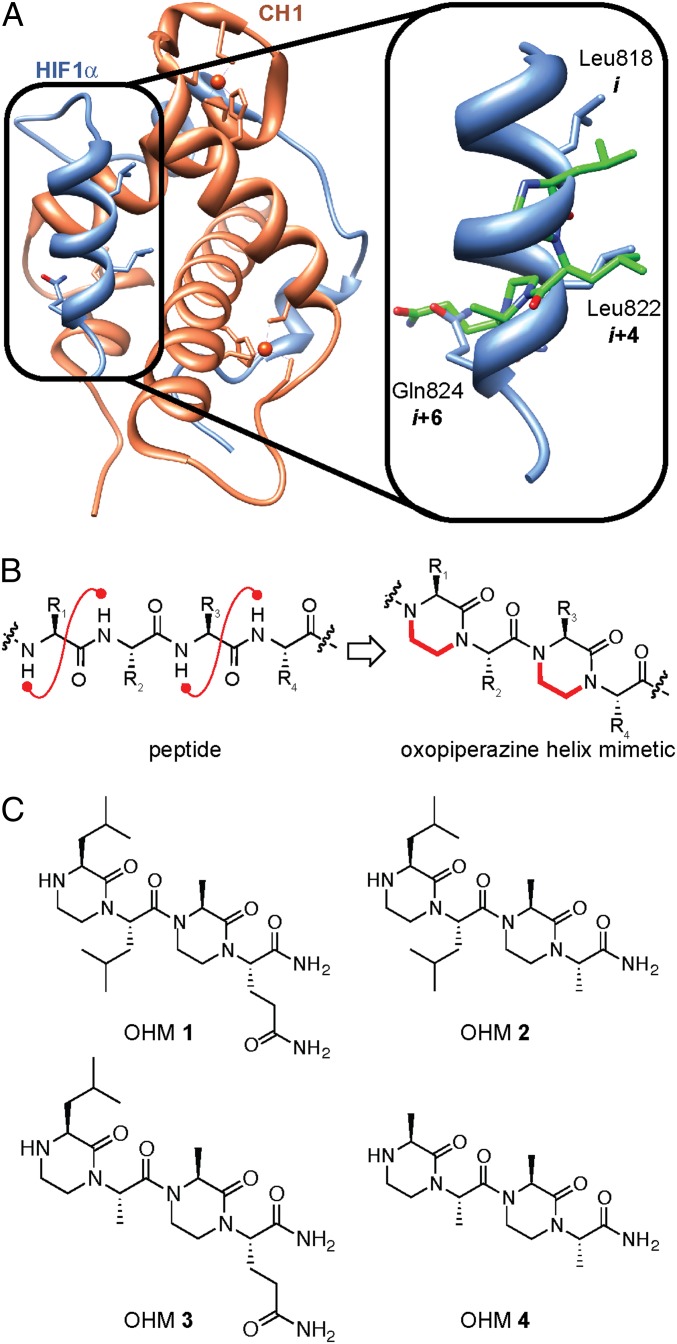
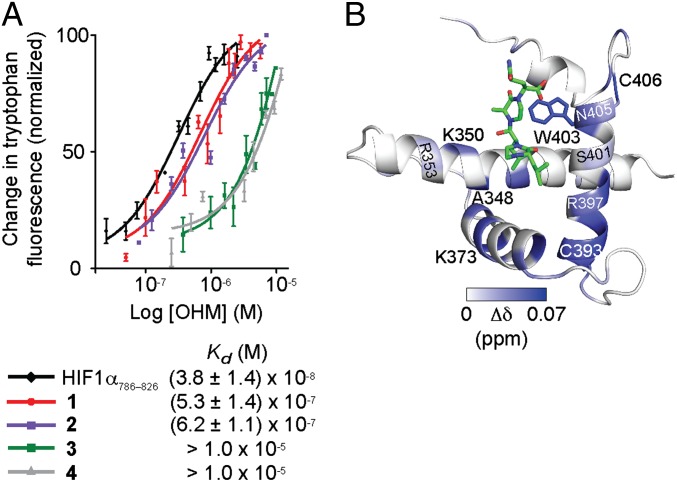
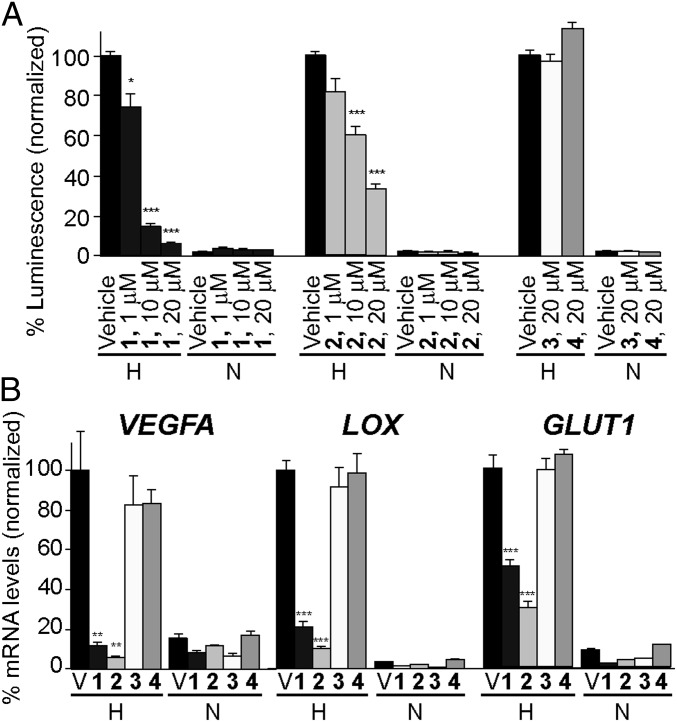
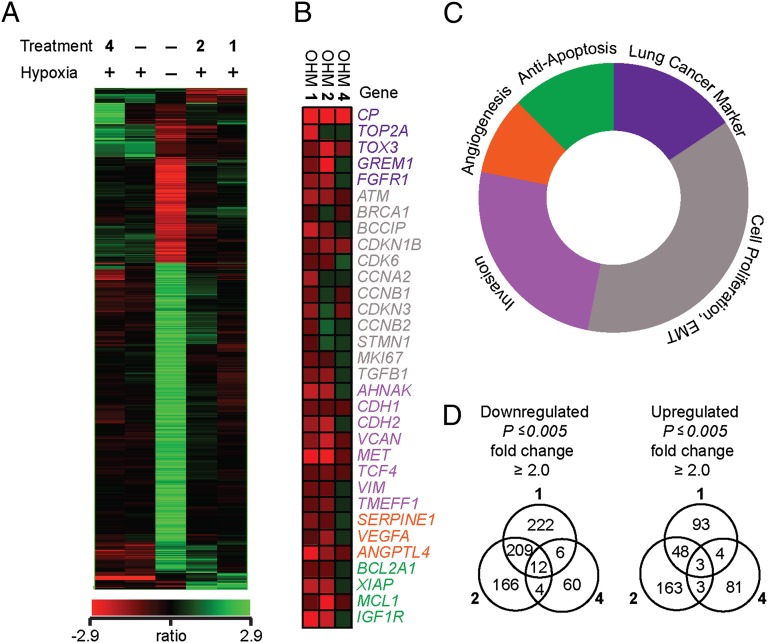
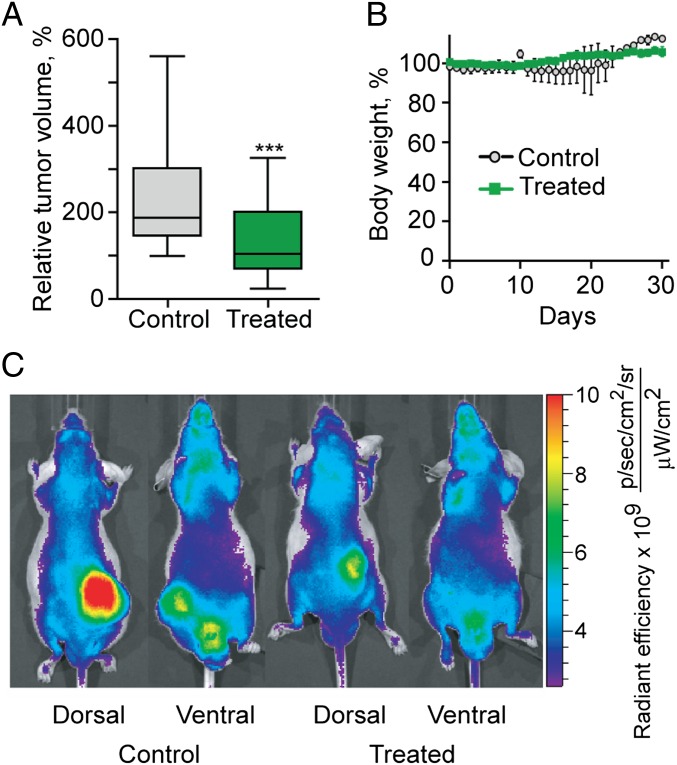
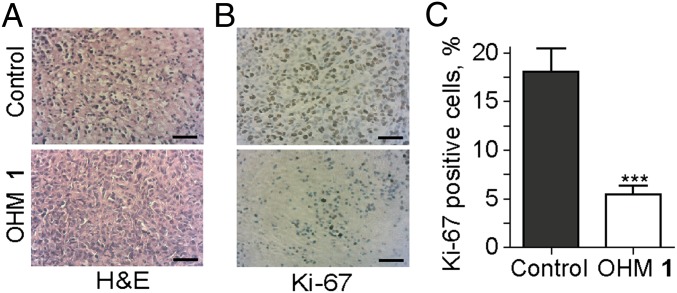
Development of small-molecule inhibitors of protein-protein interactions is a fundamental challenge at the interface of chemistry and cancer biology. Successful methods for design of protein-protein interaction inhibitors include computational and experimental high-throughput and fragment-based screening strategies to locate small-molecule fragments that bind protein surfaces. An alternative rational design approach seeks to mimic the orientation and disposition of critical binding residues at protein interfaces. We describe the design, synthesis, biochemical, and in vivo evaluation of a small-molecule scaffold that captures the topography of α-helices. We designed mimics of a key α-helical domain at the interface of hypoxia-inducible factor 1α and p300 to develop inhibitors of hypoxia-inducible signaling. The hypoxia-inducible factor/p300 interaction regulates the transcription of key genes, whose expression contributes to angiogenesis, metastasis, and altered energy metabolism in cancer. The designed compounds target the desired protein with high affinity and in a predetermined manner, with the optimal ligand providing effective reduction of tumor burden in experimental animal models.

Keywords: helix mimics; hypoxia signaling; synthetic inhibitors of transcription.


Conflict of interest statement

The authors declare no conflict of interest.

Figures

Fig. 1.
Fig. 1.
Design of HIF1α mimetics as modulators of hypoxia-inducible gene expression. (A) Model depicting complex of HIF1α and the CH1 domain of p300/CBP. Structural data was retrieved from the Protein Data Bank (PDB), ID code 1L8C. The key residues Leu818, Leu822, and Gln824 of HIF1α CTAD (shown in blue) are located in the binding pocket of the p300/CBP CH1 domain (depicted in orange). Magnified is an overlay of the HIF1α helix spanning residues 816–824 (blue) and OHM 1 (green). (B) OHMs were designed to mimic the key helical region. OHMs feature ethylene bridges between adjacent amino acid residues; the bridges lock the side chain groups in orientations that mimic α-helices. (C) OHM derivatives—positive and negative controls—designed to inhibit the target complex.
Fig. 2.
Fig. 2.
Binding affinities of designed compounds for p300–CH1. (A) The affinity of OHMs 14 and HIF1α C-TAD786–826 for the CH1 domain was determined by tryptophan fluorescence spectroscopy; the binding affinity of HIF–CTAD for p300–CH1 measured using the tryptophan fluorescence assay is in agreement with that obtained in a fluorescence polarization assay with the fluorescein-labeled derivative of the peptide (SI Appendix, Fig. S2). (B) Molecular model that depicts the results of a 1H-15N HSQC NMR titration experiment. The p300–CH1 residues undergoing chemical shift perturbations upon addition of OHM 1 are color-mapped, matching the magnitude of the chemical shift changes. The structure of the HIF1α/CH1 complex (PDB ID code 1L8C) was used to construct the model.
Fig. 3.
Fig. 3.
Transcriptional regulation of hypoxia-inducible genes by helix mimetics. OHMs 1 and 2 down-regulate hypoxia-induced promoter activity in luciferase assays (A) and transcription of VEGFA, LOX, and GLUT1 genes in cell culture as measured by real-time qRT-PCR (B). OHMs 3 and 4 show reduced inhibitory activities at the same concentrations. Error bars are ±SEM of four independent experiments. ***P < 0.001, **P < 0.01, *P < 0.05, t test. H, hypoxia; N, normoxia; V, vehicle.
Fig. 4.
Fig. 4.
Results from gene expression profiling obtained with Affymetrix Human Gene ST 1.0 arrays. (A) Hierarchical agglomerative clustering of transcripts induced or repressed twofold or more (one-way ANOVA, P ≤ 0.005) by hypoxia (GasPak EZ pouch) under the three specified conditions: -, no treatment; 1, OHM 1 (10 μM); 2, OHM 2 (10 μM); 4, OHM 4 (10 μM). Clustering was based on a Pearson-centered correlation of intensity ratios for each treatment compared with hypoxia-induced cells (controls) using average linkage as a distance. (B) Select tumor-promoting genes affected upon OHM treatment. (C) Schematic representation of genes affected by OHM 1 treatment in B color-coded in relation to hallmarks of cancer. (D) Venn diagrams representing transcripts up- and down-regulated (|fold change| ≥ 2.0, P ≤ 0.005) by OHMs 1, 2, and 4. Numbers inside the intersections represent hypoxia-induced transcripts affected by corresponding treatments.
Fig. 5.
Fig. 5.
Effect of OHM 1 treatment on tumor growth rate in MDA-MB-231 xenografts. (A) Box- and Whisker plots of the percentages of tumor volumes measured throughout the duration of the experiment: boxes represent the upper and lower quartiles and the median, and the error bars show maximum and minimum tumor volumes. ***P < 0.001. (B) Weight measurements of control (–O–) and OHM 1-treated (–■–) mice engrafted with MDA-MB-231 tumors through the course of the study. Error bars are ±SEM of the weight measurements of the mice within each experimental group. (C) Localization of the NIR contrast agent IR-783 in the tumors of the control and treated mice. The fluorescence output was processed with Living Image software with one representative sample for each group presented above. Mice from the OHM 1-treated group show lower intensity of the signal originating from the tumor-accumulated contrast agent compared with the control group.
Fig. 6.
Fig. 6.
(A) H&E-stained sections of MDA-MB-231 xenograft (purple, nuclei; pink, cytoplasm) treated with vehicle or OHM 1. (B) Anti–Ki-67–stained MDA-MB-231 xenografts (brown stain), treated with vehicle or OHM 1. (Scale bar, 50 μm.) (C) Quantification of Ki-67–stained images using ImageJ with the ImmunoRatio plugin (43). ***P < 0.001, t test.

References

    1. Wells JA, McClendon CL. Reaching for high-hanging fruit in drug discovery at protein-protein interfaces. Nature. 2007;450(7172):1001–1009. - PubMed
    1. Higueruelo AP, et al. Atomic interactions and profile of small molecules disrupting protein-protein interfaces: The TIMBAL database. Chem Biol Drug Des. 2009;74(5):457–467. - PubMed
    1. Bullock BN, Jochim AL, Arora PS. Assessing helical protein interfaces for inhibitor design. J Am Chem Soc. 2011;133(36):14220–14223. - PMC - PubMed
    1. Jochim AL, Arora PS. Systematic analysis of helical protein interfaces reveals targets for synthetic inhibitors. ACS Chem Biol. 2010;5(10):919–923. - PMC - PubMed
    1. Thompson AD, Dugan A, Gestwicki JE, Mapp AK. Fine-tuning multiprotein complexes using small molecules. ACS Chem Biol. 2012;7(8):1311–1320. - PMC - PubMed

Publication types

MeSH terms

Associated data