Review
. 2014 May 12;369(1645):20130435.
doi: 10.1098/rstb.2013.0435. Print 2014.

The coverage and frequency of mass drug administration required to eliminate persistent transmission of soil-transmitted helminths

Affiliations
Review

The coverage and frequency of mass drug administration required to eliminate persistent transmission of soil-transmitted helminths

Roy Anderson et al. Philos Trans R Soc Lond B Biol Sci. .

Abstract

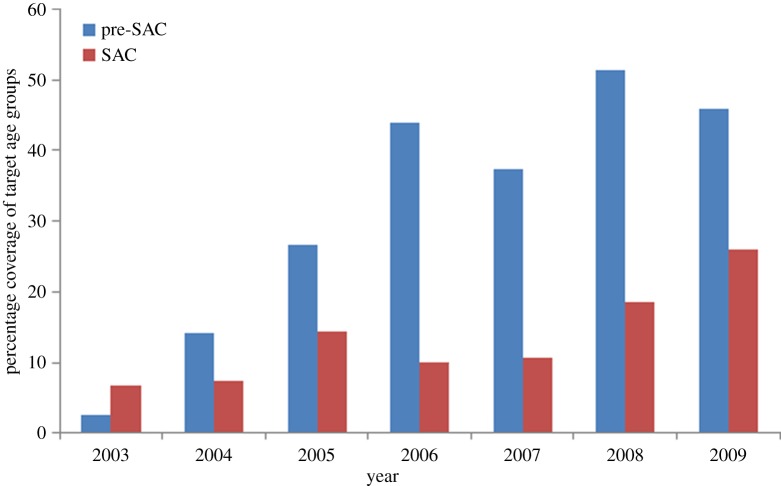
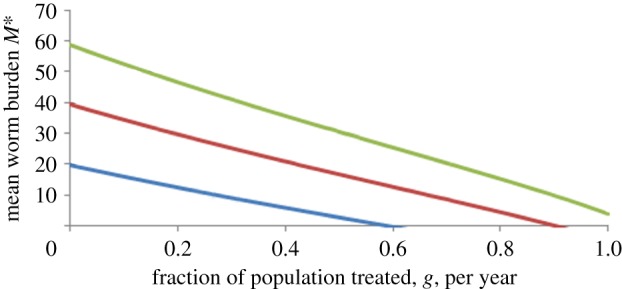
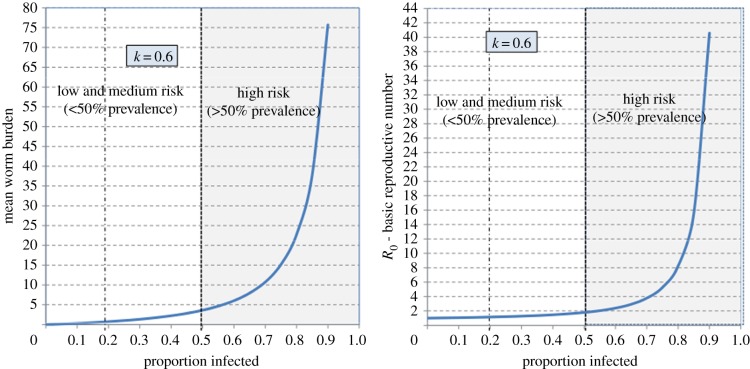
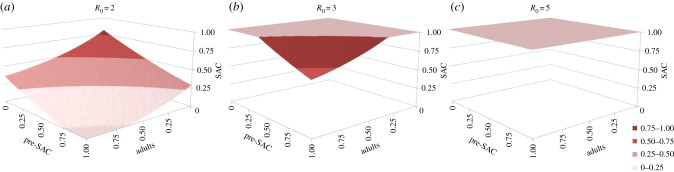
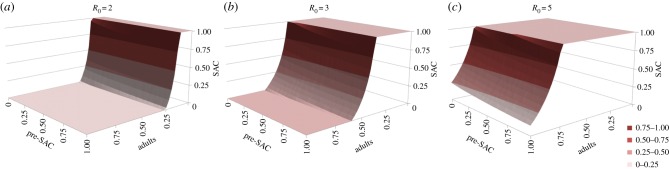
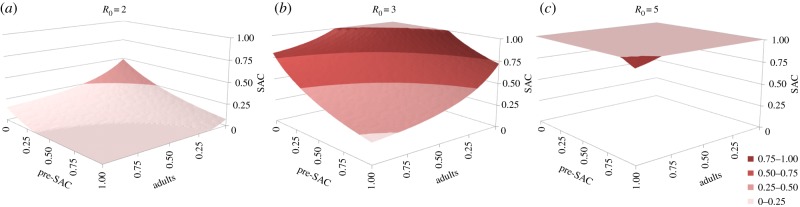
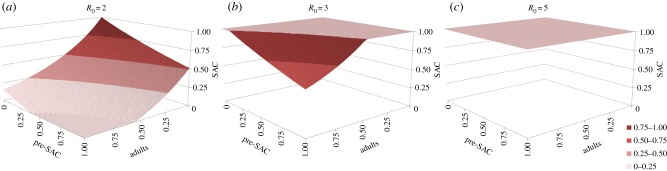
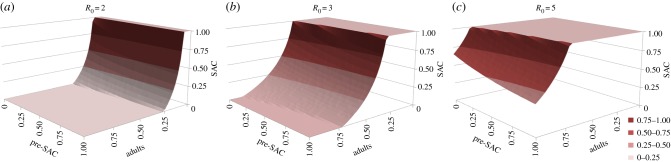
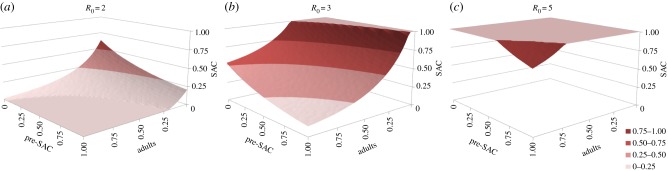
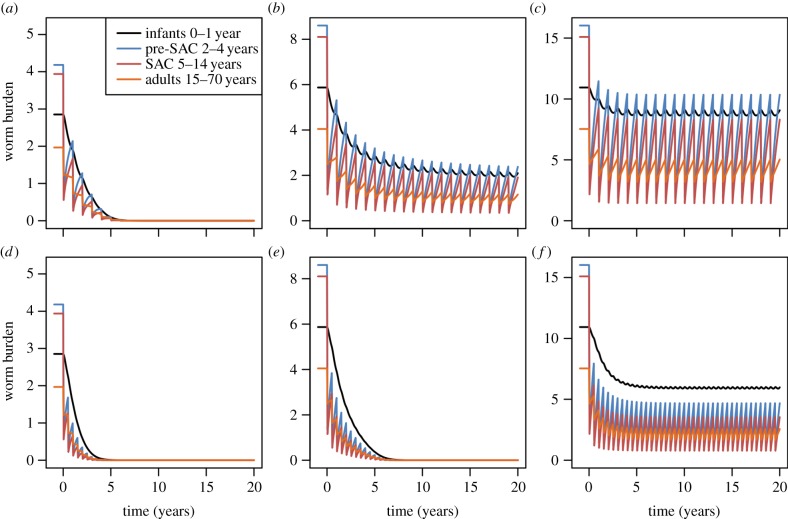
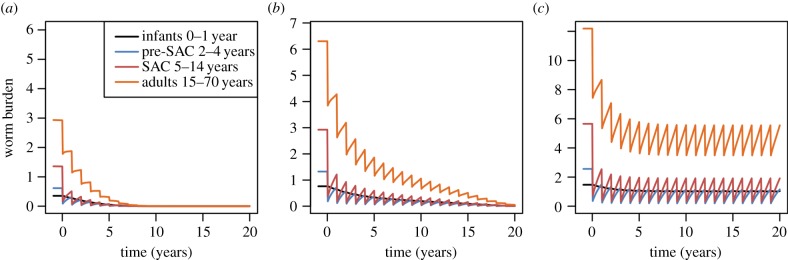
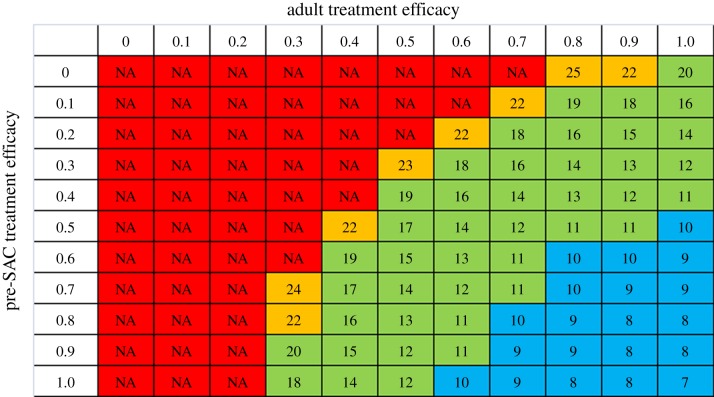
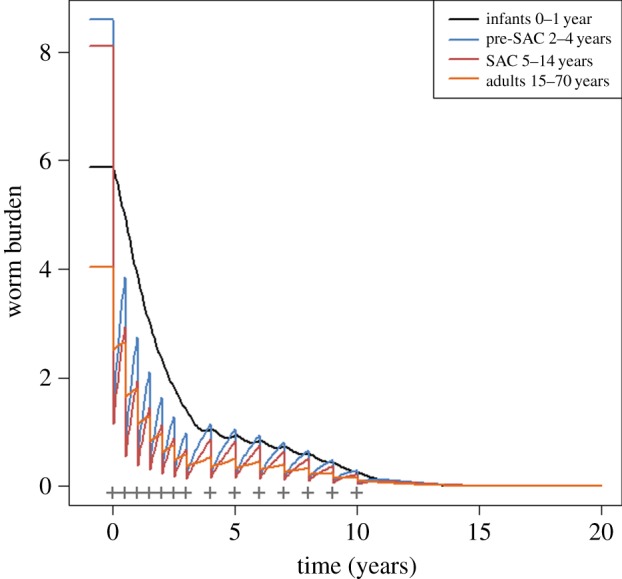
A combination of methods, including mathematical model construction, demographic plus epidemiological data analysis and parameter estimation, are used to examine whether mass drug administration (MDA) alone can eliminate the transmission of soil-transmitted helminths (STHs). Numerical analyses suggest that in all but low transmission settings (as defined by the magnitude of the basic reproductive number, R0), the treatment of pre-school-aged children (pre-SAC) and school-aged children (SAC) is unlikely to drive transmission to a level where the parasites cannot persist. High levels of coverage (defined as the fraction of an age group effectively treated) are required in pre-SAC, SAC and adults, if MDA is to drive the parasite below the breakpoint under which transmission is eliminated. Long-term solutions to controlling helminth infections lie in concomitantly improving the quality of the water supply, sanitation and hygiene (WASH). MDA, however, is a very cost-effective tool in long-term control given that most drugs are donated free by the pharmaceutical industry for poor regions of the world. WASH interventions, by lowering the basic reproductive number, can facilitate the ability of MDA to interrupt transmission.

Keywords: chemotherapy; elimination; modelling; school-based intervention; soil-transmitted helminths.


Figures

Figure 1.
Figure 1.
Coverage of preventive STH chemotherapy in pre-school-aged children (pre-SAC) and school-aged children (SAC). WHO African Region, by year, 2003–2009 [1]. (Online version in colour.)
Figure 2.
Figure 2.
(a) Relationship between total egg output per host and worm burden for hookworm predicted by observed density-dependent relationships between egg output and worm load per patient (z = 0.95, where z = exp(−γ)). (b) Density-dependent fecundity for Ascaris from the studies of Holland et al. [13] in Nigeria and (c) Elkins et al. [14] in India with z-values inset. (Online version in colour.)
Figure 3.
Figure 3.
Relationship between the proportion of the population treated per year, g, and the post-treatment equilibrium worm load (for, from bottom to top, R0 = 1.5, 2.0 and 2.5). (Online version in colour.)
Figure 4.
Figure 4.
Age–intensity profiles for mean intensity and prevalence (%) for Ascaris [19], Trichuris [33] and hookworm [34]. (Online version in colour.)
Figure 5.
Figure 5.
Approximate relationships for soil-transmitted helminths between prevalence (as a proportion) and the mean worm burden, and prevalence and the basic reproductive number R0 (simple relationship—no mating function, no age structure, see Anderson & May [7]). (Online version in colour.)
Figure 6.
Figure 6.
Critical treatment surfaces for Ascaris under annual treatment with R0 = 2, 3, 5 (a–c, respectively). Axes represent fraction effectively treated in each age group. Points above the surface lead to elimination within 20 years. Parameters: z = 0.94, k = 0.5, σ = 1 per year, β = ρ = (1.15, 1.15, 1, 0.52). (Adapted from Truscott et al. [40].) (Online version in colour.)
Figure 7.
Figure 7.
Critical treatment surfaces for hookworm under annual treatment with R0 = 2, 3, 5 (a–c, respectively). Axes represent fraction effectively treated in each age group. Points above the surface lead to elimination within 20 years. Parameters: z = 0.92, k = 0.4, σ = 0.5 per year, β = ρ = (0.5, 0.5, 1, 2). (Adapted from Truscott et al. [40].) (Online version in colour.)
Figure 8.
Figure 8.
Identical to figure 6, but with treatment of Ascaris every six months. (Adapted from Truscott et al. [40].) (Online version in colour.)
Figure 9.
Figure 9.
Critical treatment surfaces for Ascaris under annual treatment with R0 = 2, 3, 5 (a–c, respectively). As for figure 6, but with egg contribution rate, ρ, constant across all age classes. (Online version in colour.)
Figure 10.
Figure 10.
Critical treatment surfaces for hookworm under annual treatment with R0 = 2, 3, 5 (a–c, respectively). As for figure 7, but with egg contribution rate, ρ, constant across all age classes. (Online version in colour.)
Figure 11.
Figure 11.
Identical to figure 9, but with treatment of Ascaris every six months. (Online version in colour.)
Figure 12.
Figure 12.
Numerical solutions of the model for Ascaris in different transmission and treatment interval settings. Columns represent R0 = 2, 3, 5, left to right, respectively. Top row represents annual treatment and bottom row six-monthly treatment. Infants (black) are untreated, pre-SAC (blue) and SAC (red) have 90% coverage and adults (orange) have 40% coverage. Other parameter values are as defined in figure 6.
Figure 13.
Figure 13.
Graphs (a), (b) and (c) are for hookworm, where R0 is set at 2 for (a), 3 for (b) and 5 for (c). Treatment is annual; treatment coverage is as defined in the legend to figure 9 and parameters as defined in figure 7.
Figure 14.
Figure 14.
Number of rounds of six-monthly treatment to achieve Ascaris elimination as a function of pre-SAC and adult coverage. Coverage of SAC (75%). Table in the figure represents a horizontal slice through figure 11b. (Online version in colour.)
Figure 15.
Figure 15.
Elimination of Ascaris achieved with lengthened treatment interval in final stage (six intervals of six months followed by seven intervals of a year). R0 = 3; treatment levels and parameters as in figure 9. Treatments represented by grey crosses.

References

    1. World Health Organization 2013. Preventive Chemotherapy Database, Soil-transmitted helminthiases. See http://www.who.int/neglected_diseases/preventive_chemotherapy/sth/en/ind... (20 May 2013)
    1. Uniting to Combat NTDs. 2013. From promises to progress: the first report on the London Declaration on NTDs. See http://unitingtocombatntds.org/resource/promises-progress-first-report-l... .
    1. WHO 2013. Executive Board recommendations on neglected tropical diseases. See http://www.who.int/neglected_diseases/EB132_R7_en.pdf.
    1. WHO 2012. Accelerating work to overcome the global impact of neglected tropical diseases: a roadmap for implementation. Geneva, Switzerland: World Health Organization.
    1. Anderson R, Hollingsworth TD, Truscott J, Brooker S. 2012. Optimisation of mass chemotherapy to control soil-transmitted helminth infection. Lancet 379, 289–290. (10.1016/S0140-6736(12)60120-2) - DOI - PubMed

Publication types