. 2014 Jun;143(6):733-43.
doi: 10.1085/jgp.201411163. Epub 2014 May 12.

Adaptive potentiation in rod photoreceptors after light exposure

Affiliations

Adaptive potentiation in rod photoreceptors after light exposure

Alex S McKeown et al. J Gen Physiol. 2014 Jun.

Abstract

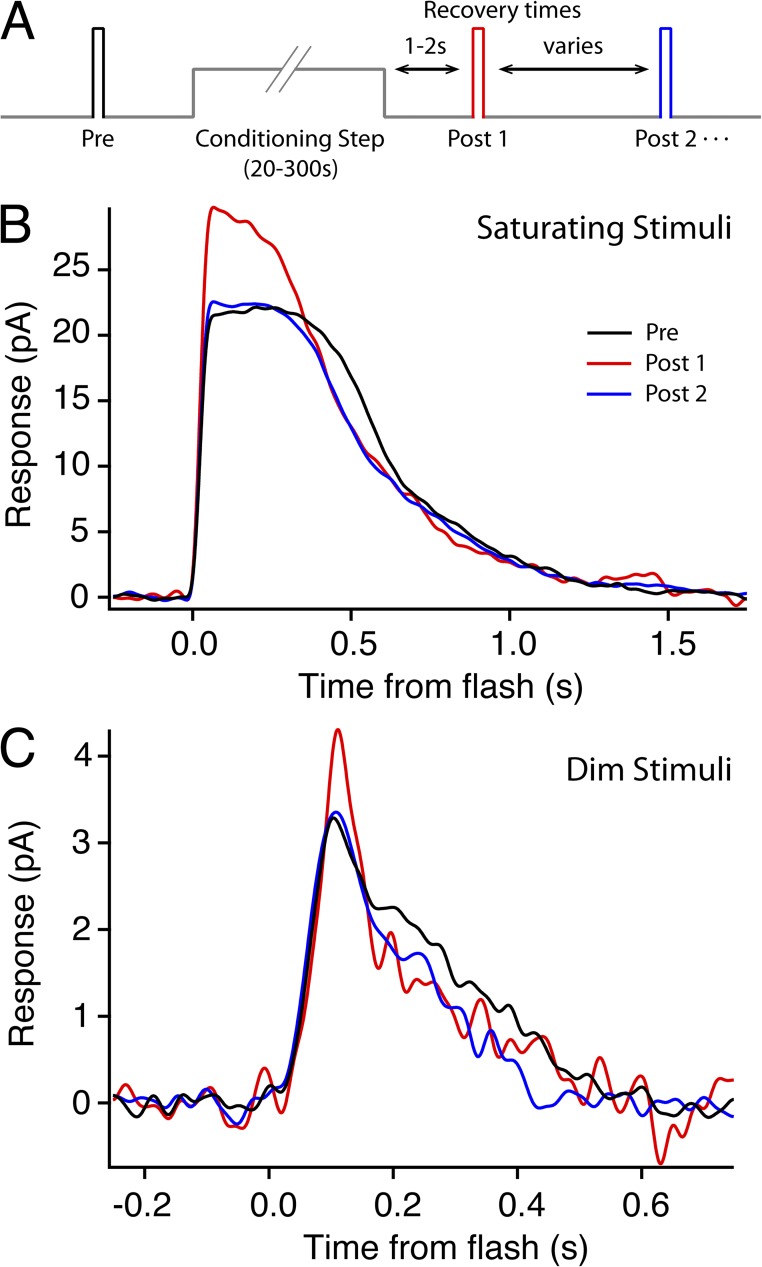
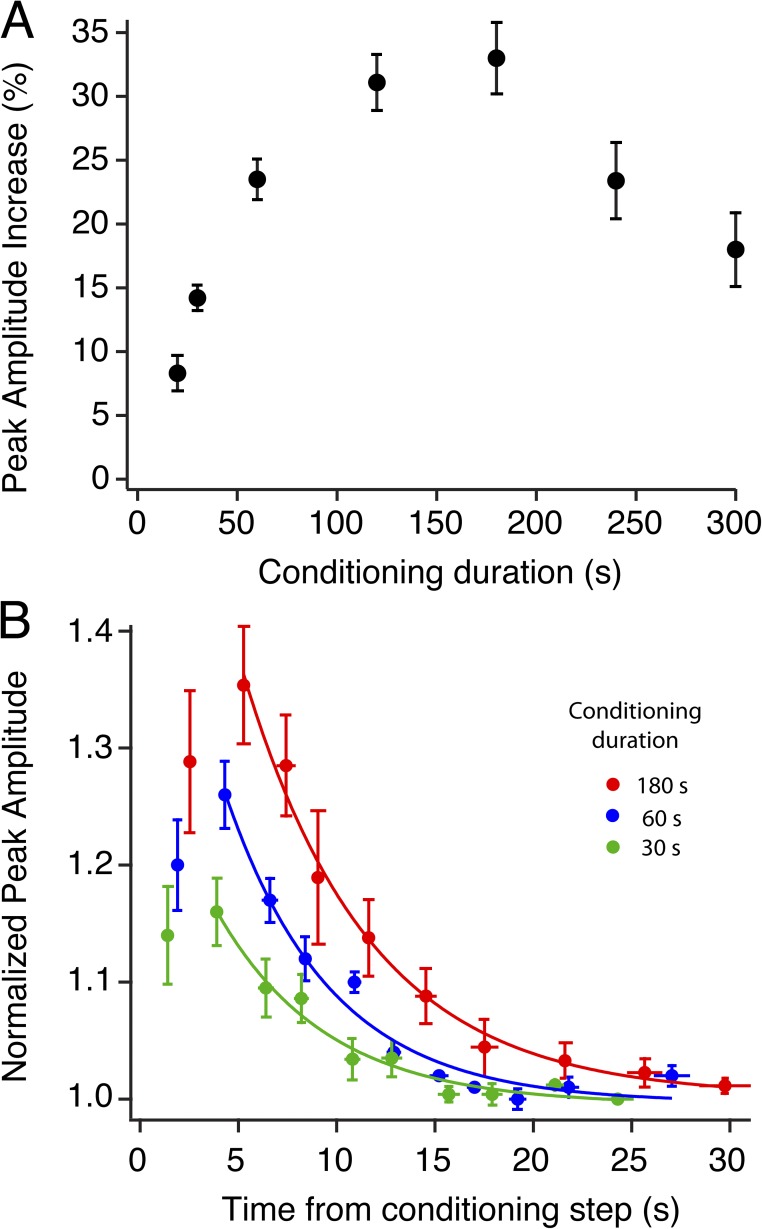
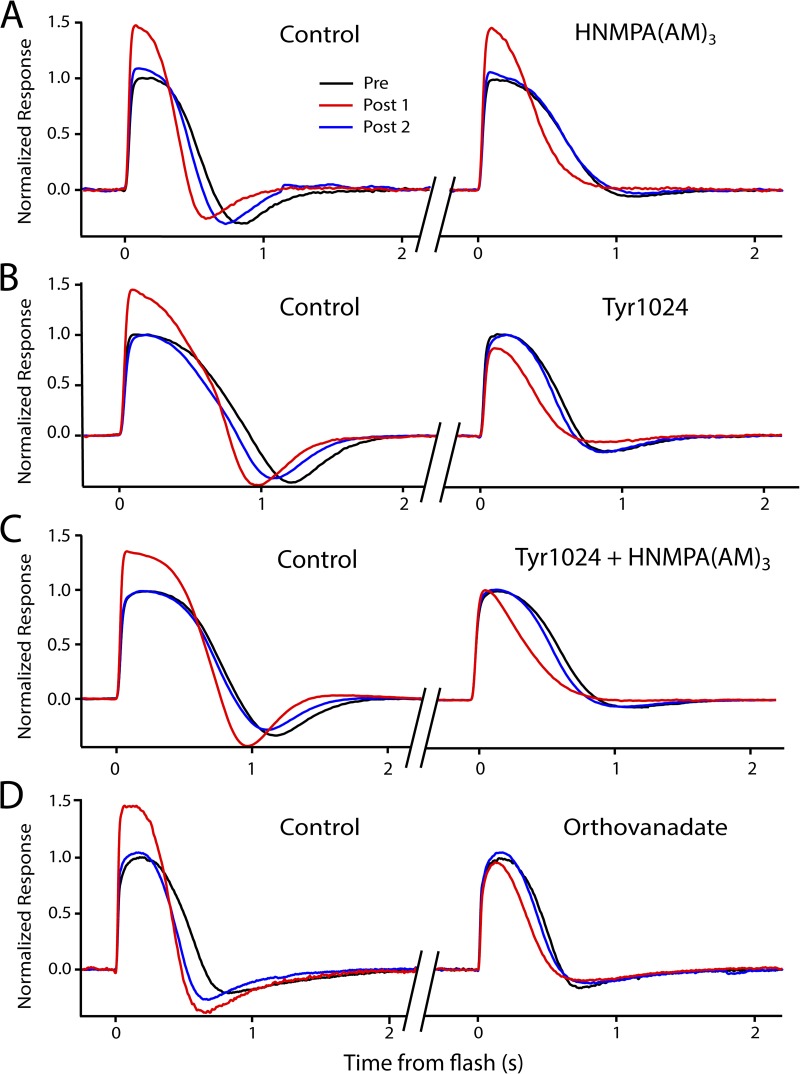
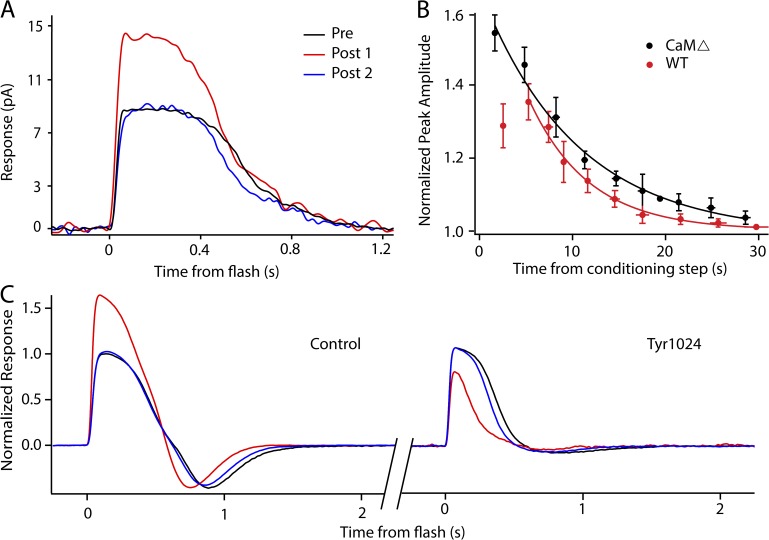
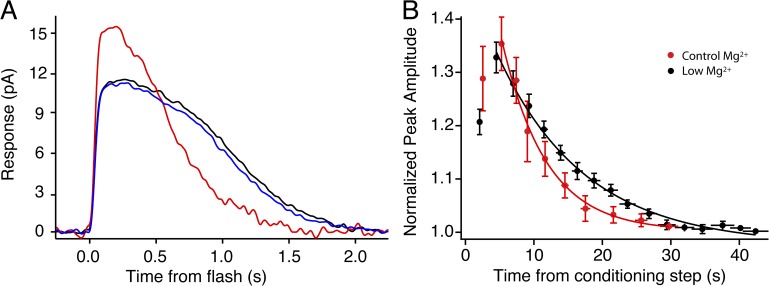
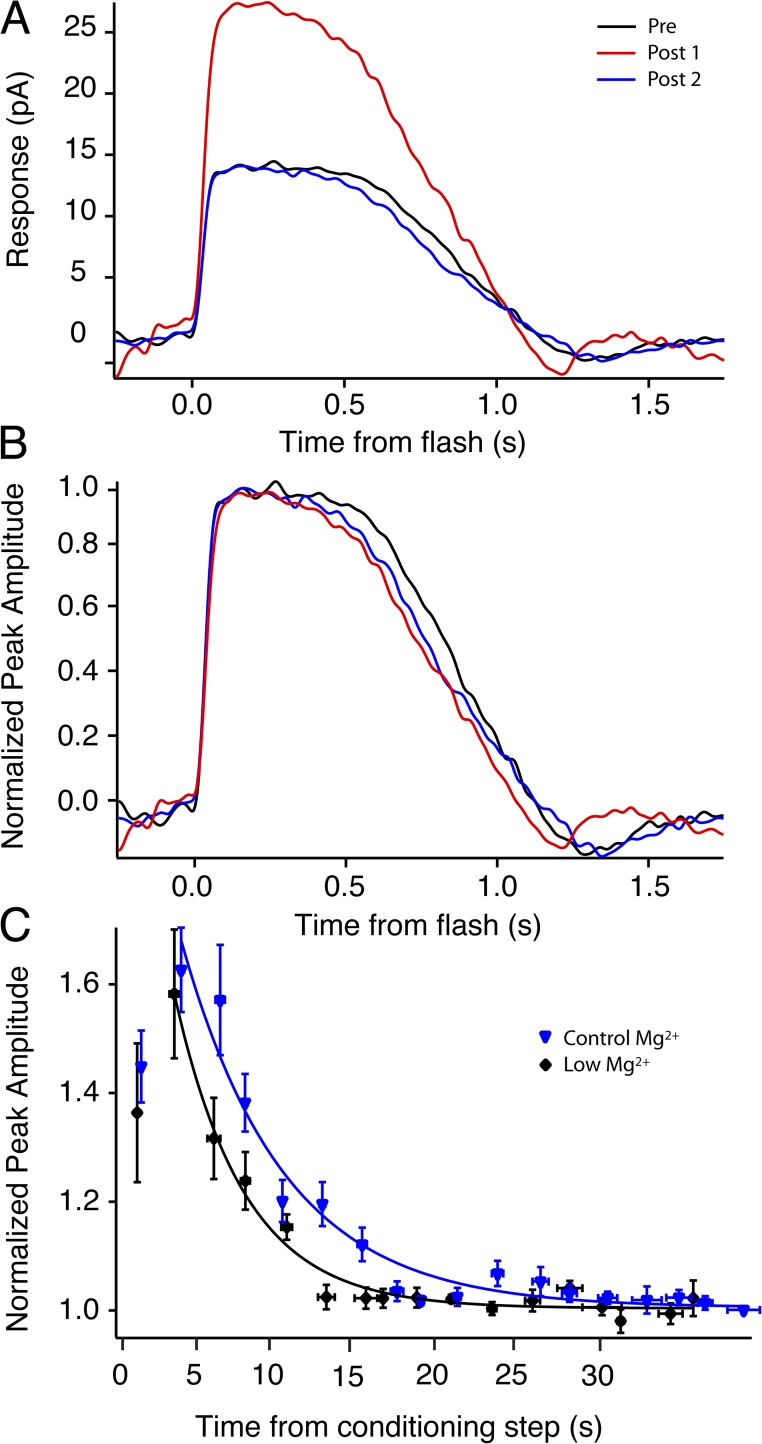
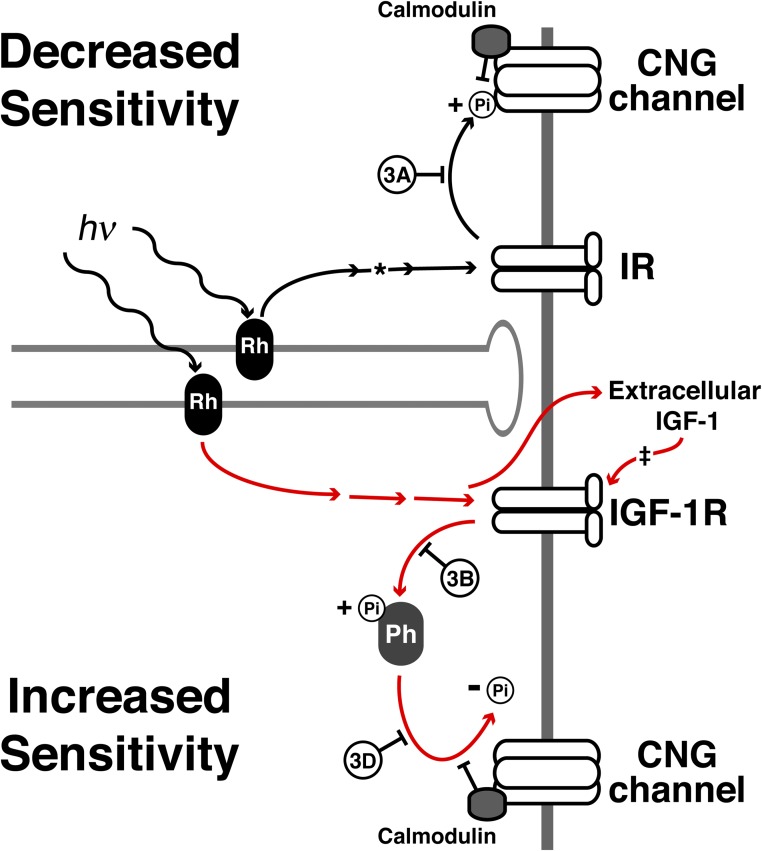
Photoreceptors adapt to changes in illumination by altering transduction kinetics and sensitivity, thereby extending their working range. We describe a previously unknown form of rod photoreceptor adaptation in wild-type (WT) mice that manifests as a potentiation of the light response after periods of conditioning light exposure. We characterize the stimulus conditions that evoke this graded hypersensitivity and examine the molecular mechanisms of adaptation underlying the phenomenon. After exposure to periods of saturating illumination, rods show a 10-35% increase in circulating dark current, an adaptive potentiation (AP) to light exposure. This potentiation grows as exposure to light is extended up to 3 min and decreases with longer exposures. Cells return to their initial dark-adapted sensitivity with a time constant of recovery of ∼7 s. Halving the extracellular Mg concentration prolongs the adaptation, increasing the time constant of recovery to 13.3 s, but does not affect the magnitude of potentiation. In rods lacking guanylate cyclase activating proteins 1 and 2 (GCAP(-/-)), AP is more than doubled compared with WT rods, and halving the extracellular Mg concentration does not affect the recovery time constant. Rods from a mouse expressing cyclic nucleotide-gated channels incapable of binding calmodulin also showed a marked increase in the amplitude of AP. Application of an insulin-like growth factor-1 receptor (IGF-1R) kinase inhibitor (Tyrphostin AG1024) blocked AP, whereas application of an insulin receptor kinase inhibitor (HNMPA(AM)3) failed to do so. A broad-acting tyrosine phosphatase inhibitor (orthovanadate) also blocked AP. Our findings identify a unique form of adaptation in photoreceptors, so that they show transient hypersensitivity to light, and are consistent with a model in which light history, acting via the IGF-1R, can increase the sensitivity of rod photoreceptors, whereas the photocurrent overshoot is regulated by Ca-calmodulin and Ca(2+)/Mg(2+)-sensitive GCAPs.


Figures

Figure 1.
Figure 1.
Photocurrents demonstrate AP after conditioning light exposure in isolated rods. (A) Schematic for all potentiation experiments. Identical test flashes were presented before and after a rod-saturating step of light. The colors of the test stimulus bars in A indicate the timing of the traces in B and C. (B) Representative saturating responses before (black, an average of three responses), 5 s after (red, single response), and 35 s after (blue, single response) the conditioning light (240 R*/s) was extinguished. Rmax increased 36%. (C) In another cell, subsaturating responses recorded before (black, average of 10 responses), 5 s after (red, single response), and 15 s after (blue, single response) a 3-min conditioning light (200 R*/s). The peak amplitude of the response increased 30%.
Figure 2.
Figure 2.
The magnitude of AP is dependent on the duration of the conditioning light exposure. (A) Compared with precondition flash amplitude, represented as baseline (0% increase), potentiated amplitudes increased in magnitude with conditioning stimulus duration up to 3 min and declined with longer exposure times. The cell numbers for the various conditioning durations were 20 s, n = 5; 30 s, n = 9; 60 s, n = 14; 120 s, n = 5; 180 s, n = 14; 240 s, n = 5; and 300 s, n = 2. (B) Pooled data of amplitudes for all cells at three conditioning durations. Red circles indicate 180 s, n = 14 ; blue circles indicate 60 s, n = 10 ; green circles indicate 30 s, n = 9. The smooth trace in each graph is an exponential fit to the mean recovery data points: red line = 180-s exposure, τrec = 6.8 s; blue line = 60-s exposure, τrec = 5.3 s; green line = 30 s exposure, τrec = 5.6 s. All responses were normalized to the preexposure (dark adapted) amplitude, and test flashes were presented every 2.5 s after light exposure. Error bars in all panels indicate ±1 SEM.
Figure 3.
Figure 3.
Kinase and phosphatase inhibitors influence light-induced potentiation in isolated retina recordings. All figures show a dark-adapted response (black trace, average of three to five responses), a response recorded 3–5 s after 3-min saturating light (red trace, single response), and a third response, recorded 20–30 s later, representing recovery (blue trace, single response). (A–D) Each panel shows two potentiation experiments on a single retina before (left) and after (right) the application of the indicated drug or drugs. (A) Potentiation is present in control solution (left), showing a 46% increase in peak amplitude before application of HNMPA(AM)3, a specific blocker of IR kinase activity. The presence of 200 µM HNMPA(AM)3 did not affect the potentiation (right), as the potentiation (red trace) persists in the presence of the inhibitor. (B) Potentiation is present in control solution (left), showing a 36% increase in amplitude before application of Tyr1024, a specific blocker of IGF-1R kinase activity. The presence of 250 nM Tyr1024 eliminated the potentiation (right) after a conditioning light; in fact, there was a decrease in amplitude that recovered with time (blue trace). (C) Application of both 250 nM Tyr1024 and 200 µM HNMPA(AM)3 eliminates potentiation and the amplitude reduction after light exposure seen with Try1024 alone. (D) Potentiation is present in control solution (left), showing a 44% increase in amplitude before application of orthovanadate, a broad-acting inhibitor of tyrosine phosphatases. The presence of 200 µM orthovanadate eliminates the potentiation (right).
Figure 4.
Figure 4.
AP is larger and appears sooner in CaMΔ rods. (A) A representative trace from a single CaMΔ cell exhibiting potentiation. The response increased 60%, from 9.2 pA in darkness (black trace) to 14.7 pA (red trace) after a 3-min conditioning exposure. The response recovered to baseline (blue trace) with a time constant of 7.2 s. (B) Response amplitudes of AP after 3-min conditioning stimulus (off at t = 0). Pooled data from WT (red circles; n = 15) and CaMΔ rods (black circles; n = 14) demonstrate an overall increase in amplitude and a faster time to peak of the adaptation in CaMΔ rods. Traces represent exponential fits to ensemble data for WT (red line), τrec = 6.8 ± 0.7 s; and CaMΔ (black line), τrec = 8.5 ± 0.8 s. Error bars indicate ±1 SEM. (C) A larger potentiation was also present in isolated CaMΔ retina ERGs, increasing 64% from 175 µV (black trace) to 287 µV (red trace) after a 3-min conditioning exposure before recovering to baseline (blue trace). Potentiation in the same retina was blocked with application of 250 nM Tyr1024 (right). The response amplitude was reduced after the conditioning light exposure (red trace), similar to the results in WT, and then recovered to baseline amplitude (blue trace).
Figure 5.
Figure 5.
Lowering extracellular Mg2+ prolongs the period of AP in isolated rods. (A) A representative trace exhibiting potentiation in low extracellular Mg2+. The response increased 34%, from 11.6 pA in darkness (black trace) to 15.6 pA (red trace) after a 3-min conditioning exposure. The response recovered to baseline (blue trace) with a time constant of 11.9 s. (B) Traces represent an exponential fit to the recovery of AP after a 3-min conditioning stimulus (off at t = 0). Results were normalized to the dark-adapted amplitude. Recovery in standard, 2.4 mM [Mg2+]ext (red line), τrec = 6.8 ± 0.7 s, n = 15; recovery in low, 1.2 mM [Mg2+]ext (black line) τrec = 13.3 ± 1.2 s. Error bars indicate ±1 SEM.
Figure 6.
Figure 6.
AP is present in GCAP−/− mice and is unaffected by extracellular Mg2+ concentration. (A) Representative potentiation in a GCAP−/− rod, showing an increase of 92%, from 14.2 pA in darkness (black trace) to 27.3 pA (red trace) after a 3-min conditioning exposure. The response recovered to baseline (blue trace) with a time constant of 4.3 s. (B) Normalizing the responses in A shows no acceleration (reduction of the saturation period) after the conditioning exposure, contrary to what is seen in WT and CaMΔ mice. (C) Pooled data of recovering amplitudes for GCAP−/− cells in normal and low extracellular Mg2+. The smooth trace in each graph is an exponential fit to the mean recovery data points. Time constants of recovery were not significantly different between conditions: normal Mg2+ (blue line), τrec = 5.97 ± 0.99 s, n = 12; low Mg2+ (black line), τrec = 4.40 ± 0.37 s, n = 6. All responses were normalized to the preexposure (dark adapted) amplitude and test flashes. Error bars indicate ±1 SEM.
Figure 7.
Figure 7.
A model representing a possible mechanism of AP. The established pathway between rhodopsin (Rh), the IR, and the CNG channel is likely not involved in AP, as blocking IR kinase activity failed to abolish the adaptation (top path, inhibition experiment in Fig. 3 A). The asterisk represents work by Rajala and Anderson (2003), Rajala et al. (2007), Gupta et al. (2012), and Woodruff et al. (2014). The red lines represent the proposed pathways involved in increasing sensitivity. Here, incident light activates the IGF-1R, possibly through a pathway similar to the IR or through a separate pathway involving extracellular IGF-1 release. The IGF-1R then activates a phosphatase (Ph) that dephosphorylates the CNG channel, increasing channel sensitivity for cGMP. Blocking the activity of the IGF-1R or the tyrosine phosphatase eliminates AP (bottom path, inhibition experiments in Fig. 3, B and D). The ‡ represents work by Savchenko et al. (2001), in which the effects of externally applied IGF-1 were demonstrated. Calmodulin is present in both the top and bottom panels, indicating a potential role for interference of kinase or phosphatase activity as proposed by Krajewski et al. (2003) and supported by Fig. 4 D.

Similar articles

Cited by

References

    1. Azevedo A.W., Rieke F. 2011. Experimental protocols alter phototransduction: the implications for retinal processing at visual threshold. J. Neurosci. 31:3670–3682 10.1523/JNEUROSCI.4750-10.2011 - DOI - PMC - PubMed
    1. Bauer P.J. 1996. Cyclic GMP-gated channels of bovine rod photoreceptors: affinity, density and stoichiometry of Ca2+–calmodulin binding sites. J. Physiol. 494:675–685 - PMC - PubMed
    1. Baylor D.A., Lamb T.D., Yau K.-W. 1979. Responses of retinal rods to single photons. J. Physiol. 288:613–634 - PMC - PubMed
    1. Blum G., Gazit A., Levitzki A. 2000. Substrate competitive inhibitors of IGF-1 receptor kinase. Biochemistry. 39:15705–15712 10.1021/bi001516y - DOI - PubMed
    1. Breton M.E., Schueller A.W., Lamb T.D., Pugh E.N., Jr 1994. Analysis of ERG a-wave amplification and kinetics in terms of the G-protein cascade of phototransduction. Invest. Ophthalmol. Vis. Sci. 35:295–309 - PubMed

Publication types

MeSH terms