

A Brief Review: The Z-curve Theory and its Application in Genome Analysis
- PMID: 24822026
- PMCID: PMC4009844
- DOI: 10.2174/1389202915999140328162433
A Brief Review: The Z-curve Theory and its Application in Genome Analysis
Abstract
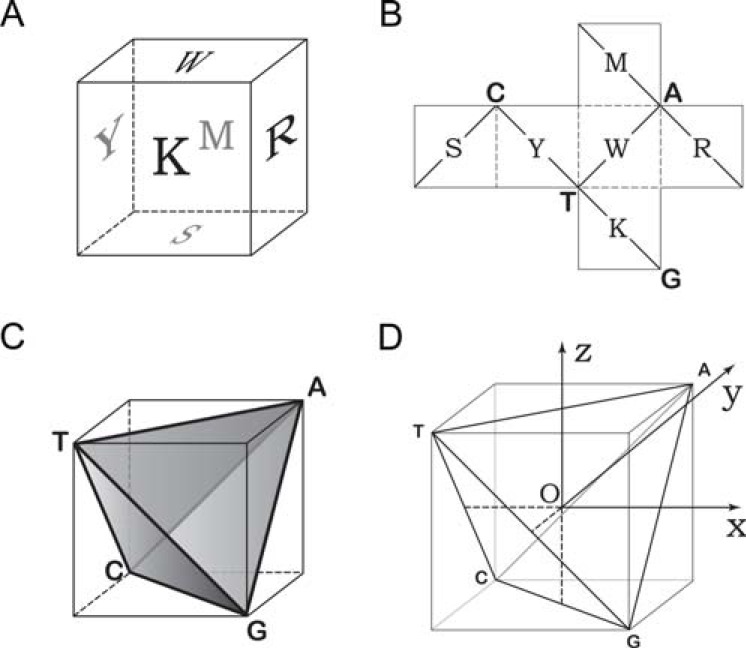
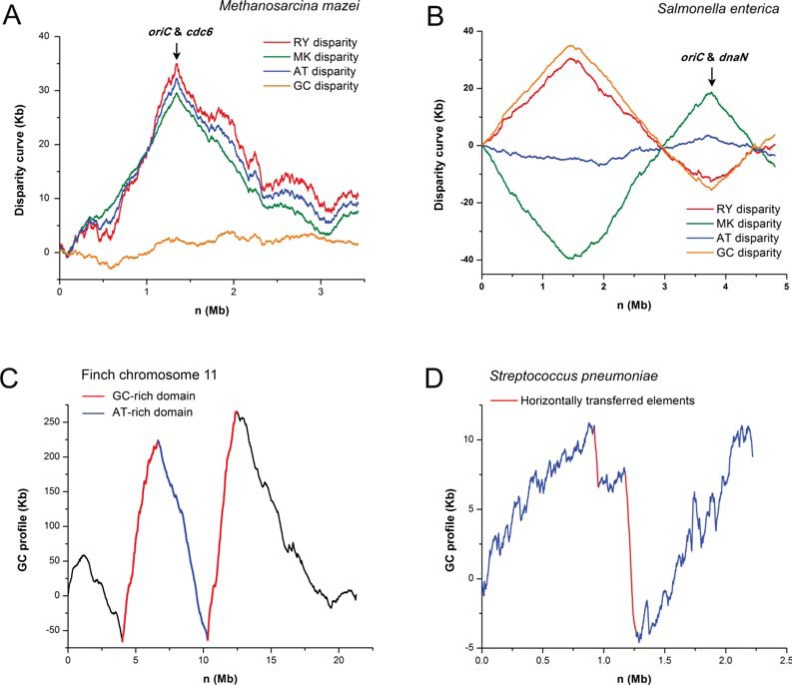
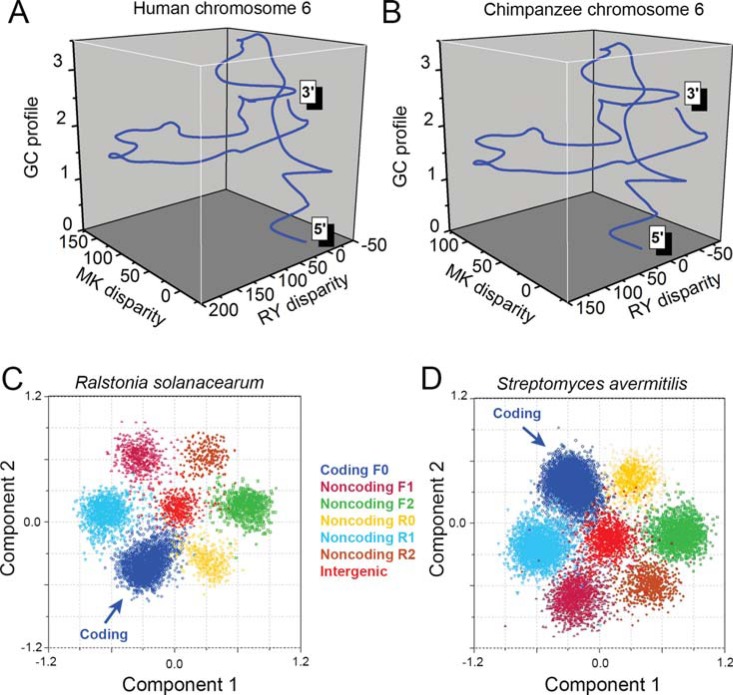
In theoretical physics, there exist two basic mathematical approaches, algebraic and geometrical methods, which, in most cases, are complementary. In the area of genome sequence analysis, however, algebraic approaches have been widely used, while geometrical approaches have been less explored for a long time. The Z-curve theory is a geometrical approach to genome analysis. The Z-curve is a three-dimensional curve that represents a given DNA sequence in the sense that each can be uniquely reconstructed given the other. The Z-curve, therefore, contains all the information that the corresponding DNA sequence carries. The analysis of a DNA sequence can then be performed through studying the corresponding Z-curve. The Z-curve method has found applications in a wide range of areas in the past two decades, including the identifications of protein-coding genes, replication origins, horizontally-transferred genomic islands, promoters, translational start sides and isochores, as well as studies on phylogenetics, genome visualization and comparative genomics. Here, we review the progress of Z-curve studies from aspects of both theory and applications in genome analysis.
Keywords: GC profile; Gene finding; Genomic island; Replication origin; Z-curve..
Figures
Similar articles
-
Identification of replication origins in archaeal genomes based on the Z-curve method.Archaea. 2005 May;1(5):335-46. doi: 10.1155/2005/509646. Archaea. 2005. PMID: 15876567 Free PMC article. Review.
-
The Z curve database: a graphic representation of genome sequences.Bioinformatics. 2003 Mar 22;19(5):593-9. doi: 10.1093/bioinformatics/btg041. Bioinformatics. 2003. PMID: 12651717
-
Multiple replication origins of the archaeon Halobacterium species NRC-1.Biochem Biophys Res Commun. 2003 Mar 21;302(4):728-34. doi: 10.1016/s0006-291x(03)00252-3. Biochem Biophys Res Commun. 2003. PMID: 12646230
-
Single replication origin of the archaeon Methanosarcina mazei revealed by the Z curve method.Biochem Biophys Res Commun. 2002 Sep 20;297(2):396-400. doi: 10.1016/s0006-291x(02)02214-3. Biochem Biophys Res Commun. 2002. PMID: 12237132
-
Recent development of Ori-Finder system and DoriC database for microbial replication origins.Brief Bioinform. 2019 Jul 19;20(4):1114-1124. doi: 10.1093/bib/bbx174. Brief Bioinform. 2019. PMID: 29329409 Review.
Cited by
-
Improved Classification of Lung Cancer Using Radial Basis Function Neural Network with Affine Transforms of Voss Representation.PLoS One. 2015 Dec 1;10(12):e0143542. doi: 10.1371/journal.pone.0143542. eCollection 2015. PLoS One. 2015. PMID: 26625358 Free PMC article.
-
MSLP: mRNA subcellular localization predictor based on machine learning techniques.BMC Bioinformatics. 2023 Mar 22;24(1):109. doi: 10.1186/s12859-023-05232-0. BMC Bioinformatics. 2023. PMID: 36949389 Free PMC article.
-
A Historic Retrospective on the Early Bioinformatics Research in China.Genomics Proteomics Bioinformatics. 2023 Oct;21(5):897-899. doi: 10.1016/j.gpb.2023.10.006. Epub 2023 Nov 3. Genomics Proteomics Bioinformatics. 2023. PMID: 37923291 Free PMC article. No abstract available.
-
Mitochondrial genome plasticity of mammalian species.BMC Genomics. 2024 Mar 14;25(1):278. doi: 10.1186/s12864-024-10201-9. BMC Genomics. 2024. PMID: 38486136 Free PMC article.
-
Nmix: a hybrid deep learning model for precise prediction of 2'-O-methylation sites based on multi-feature fusion and ensemble learning.Brief Bioinform. 2024 Sep 23;25(6):bbae601. doi: 10.1093/bib/bbae601. Brief Bioinform. 2024. PMID: 39550226 Free PMC article.
References
-
- Zhang R, Zhang CT. Z-curves, an intuitive tool for visualizing and analyzing the DNA sequences. J. Biomol. Struct. Dyn. 1994;11 (4):767–782. - PubMed
-
- Zhang CT. A symmetrical theory of DNA sequences and its applications. J. Theor. Biol. 1997;187 (3):297–306. - PubMed
-
- Hamori E, Ruskin J. H curves, a novel method of representation of nucleotide series especially suited for long DNA sequences. J. Biol. Chem. 1983;258 (2):1318–1327. - PubMed
-
- Lobry JR. A simple vectorial representation of DNA sequences for the detection of replication origins in bacteria. Biochimie. 1996;78 (5):323–326. - PubMed
LinkOut - more resources
Full Text Sources
Other Literature Sources
Miscellaneous