. 2014 Apr;15(2):130-59.
doi: 10.2174/1389202915666140319002221.

Genome scale modeling in systems biology: algorithms and resources

Affiliations

Genome scale modeling in systems biology: algorithms and resources

Ali Najafi et al. Curr Genomics. 2014 Apr.

Abstract

In recent years, in silico studies and trial simulations have complemented experimental procedures. A model is a description of a system, and a system is any collection of interrelated objects; an object, moreover, is some elemental unit upon which observations can be made but whose internal structure either does not exist or is ignored. Therefore, any network analysis approach is critical for successful quantitative modeling of biological systems. This review highlights some of most popular and important modeling algorithms, tools, and emerging standards for representing, simulating and analyzing cellular networks in five sections. Also, we try to show these concepts by means of simple example and proper images and graphs. Overall, systems biology aims for a holistic description and understanding of biological processes by an integration of analytical experimental approaches along with synthetic computational models. In fact, biological networks have been developed as a platform for integrating information from high to low-throughput experiments for the analysis of biological systems. We provide an overview of all processes used in modeling and simulating biological networks in such a way that they can become easily understandable for researchers with both biological and mathematical backgrounds. Consequently, given the complexity of generated experimental data and cellular networks, it is no surprise that researchers have turned to computer simulation and the development of more theory-based approaches to augment and assist in the development of a fully quantitative understanding of cellular dynamics.

Keywords: Biological network.; Genome-scale modeling; Modeling algorithms; Systems biology.


Figures
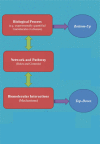
Fig. (1)
Fig. (1)
A scheme showing the relationship between the two main approaches to modeling biological systems, the top-down approach that works from the whole to the parts of a system, and the bottom-up approach, going from the parts to the whole.
Fig. (2)
Fig. (2)
Schematic representation of developing a model cell from a real cell using high-throughput omics technologies.
Fig. (3)
Fig. (3)
A) Undirected graph. B) Directed graph. C) Weighted directed graph.
Fig. (4)
Fig. (4)
Citrate cycle (TCA cycle) from KEGG (map 00020). Metabolites are represented as circles and reactions as rectangles labeled by the EC number of the enzyme that catalyzes the reaction. The directed edges exist only between metabolites and reactions. The dashed edges lead to or come from other pathways.
Fig. (5)
Fig. (5)
Example from part of E. coli GRN in which the nodes Cbl and CysB are transcription factors which regulate other genes.
Fig. (6)
Fig. (6)
Protein-protein interaction network for human TP53 produced from STRING database. The nodes represent genes and the edges interactions. Thicker lines indicate a stronger association.
Fig. (7)
Fig. (7)
A static model of cell cycle created by CellDesigner (http://www.pantherdb.org).
Fig. (8)
Fig. (8)
A comparison between modeling algorithms and their ability in modeling of biological processes.
Fig. (9)
Fig. (9)
Computational simulation of reaction rates with mass action kinetics. A) Zero-order reaction kinetics. B) First-order reaction kinetics. C) Second-order reaction kinetics. D) Reversible reaction kinetics. E) Consecutive reaction kinetics. The unit of vertical coordinate is micromol/liter.
Fig. (10)
Fig. (10)
PN model of the chemical equation system: (1) r1: A + 2 B ® 2 C + 3 D, (2) r2: 3 D ® E, (3) f (forward) and b (backward): 2 C + E « F, and (4) fb (feedback): F ® A + 2B in the initial marking (1,2,0,0,0,0), giving the token distribution on all places (A,B,C,D,E,F) and in the marking after firing of r1, resulting in the system state (0,0,2,3,0,0). The figures were drawn using MonaLisa.
Fig. (11)
Fig. (11)
The reachability graph RG of the PN in Fig. 10. Each node represents a system state and the arcs the corresponding transformations of one state into another one labeled by the transition that has then to fire.
Fig. (12)
Fig. (12)
The two t-invariants of the PN of Fig. 10 each colored in red. The second t-invariant (right side) is trivial t-invariant, it represents just a reversible reaction, consisting of a forward and a backward reaction.
Fig. (13)
Fig. (13)
A simple representation of Boolean network model and their regulation functions.
Fig. (14)
Fig. (14)
A simple Bayesian network with two nodes.
Fig. (15)
Fig. (15)
Comparison of the MM reaction simulation using CA (dots) in two different Km values (3.0 and 0.3) with the analytical result (two gray curves) (Vmax = 1).
Fig. (16)
Fig. (16)
The MAPK signaling cascade. Dashed lines indicate catalyst action.
Fig. (17)
Fig. (17)
A spatial model of the eight MAPK molecules’ concentration dependence on the propensity of enzyme E3.
Fig. (18)
Fig. (18)
A schematic representation of a hierarchical multi-agent framework (http://www.negenborn.net/rudy/phd).
Fig. (19)
Fig. (19)
Different kinds of analyses of reconstructed metabolic models and their applications.
Fig. (20)
Fig. (20)
Overlap between important network and pathway databases and their interaction.
Fig. (21)
Fig. (21)
An overview of Cytoscape start window.
Fig. (22)
Fig. (22)
An overview of VANTED start window.
Fig. (23)
Fig. (23)
A) A simple pathway created by VANTED. B) Flux balance analysis of the pathway A using VANTED.
Fig. (24)
Fig. (24)
An output of CellDesigner.
Fig. (25)
Fig. (25)
Graphical interface of SQUAD program. The output of SQUAD program describes the identified steady states of T-helper cell network. The network is loaded into SQUAD using an SBML file. State1: all the nodes inactive, State2: Active IFNγ, and State3: Active IL-4.
Fig. (26)
Fig. (26)
Simulation results of Virtual Cell program. The virtual Cell model used to model of an enzymatic reaction over ten stochastic trajectories at t = 4.0 obtained from 1000 trials. The reactions and network topology imported into Virtual Cell from the KEGG database automatically.
Fig. (27)
Fig. (27)
Flow chart of the steps involved in the preparation of a computational model. Initially, the model is defined as the network. Once the interactions between components are set up, parameters are collected from the different sources. The simulation results and predictions can be compared with the experimental results or use of experimental design.
Fig. (28)
Fig. (28)
Modeling workflow processes.

Similar articles

Cited by

References

    1. Kitano H. Systems biology: a brief overview. Science. 2002;295(5560):1662–4. - PubMed
    1. Friboulet A, Thomas D. Systems biology—an interdisciplinary approach. Biosens. Bioelectron. 2005;20(12):2404–2407. - PubMed
    1. Laval J M, Mazeran P E, Thomas D. Nanobiotechnology and its role in the development of new analytical devices. Analyst. 2000;125(1):29–33. - PubMed
    1. Westerhoff H V, Palsson B O. The evolution of molecular biology into systems biology. Nat. Biotechnol. 2004;22(10):1249–52. - PubMed
    1. (a) Covert M W, Schilling C H, Famili I, Edwards J S, Goryanin II, Selkov E, Palsson B O. Metabolic modeling of microbial strains in silico. Trends Biochem. Sci. 2001;26(3):179–86. - PubMed
    2. (b) Palsson B, Zengler K. The challenges of integrating multi-omic data sets. Nat. Chem. Biol. 2010;6(11):787–9. - PubMed

LinkOut - more resources