. 2014 May 13;9(5):e97222.
doi: 10.1371/journal.pone.0097222. eCollection 2014.

Impairment of visual function and retinal ER stress activation in Wfs1-deficient mice

Affiliations

Impairment of visual function and retinal ER stress activation in Wfs1-deficient mice

Delphine Bonnet Wersinger et al. PLoS One. .

Abstract

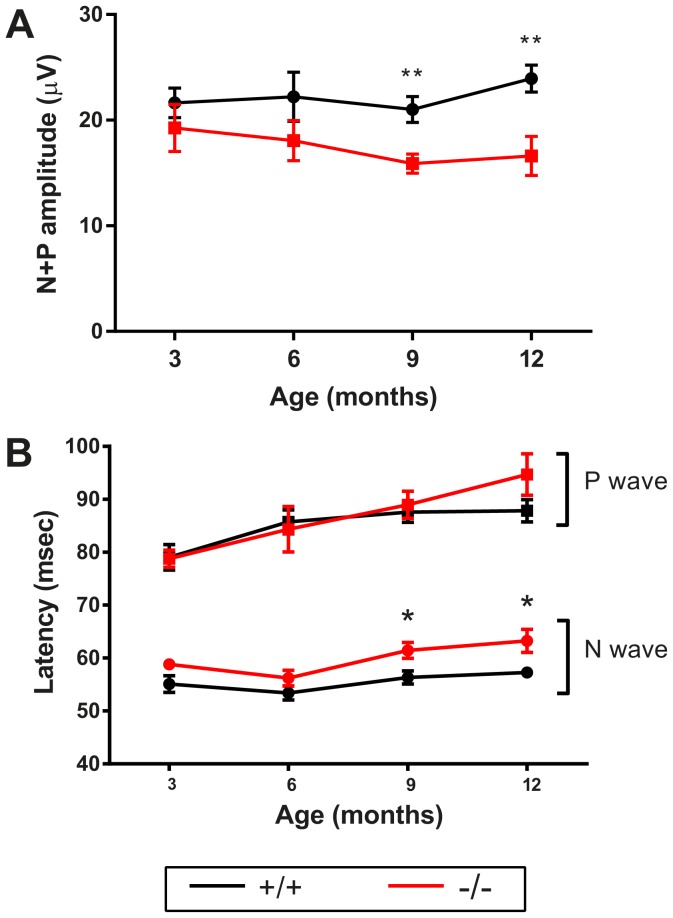
Wolfram syndrome is an early onset genetic disease (1/180,000) featuring diabetes mellitus and optic neuropathy, associated to mutations in the WFS1 gene. Wfs1-/- mouse model shows pancreatic beta cell atrophy, but its visual performance has not been investigated, prompting us to study its visual function and histopathology of the retina and optic nerve. Electroretinogram and visual evoked potentials (VEPs) were performed in Wfs1-/- and Wfs1+/+ mice at 3, 6, 9 and 12 months of age. Fundi were pictured with Micron III apparatus. Retinal ganglion cell (RGC) abundance was determined from Brn3a immunolabeling of retinal sections. RGC axonal loss was quantified by electron microscopy in transversal optic nerve sections. Endoplasmic reticulum stress was assessed using immunoglobulin binding protein (BiP), protein disulfide isomerase (PDI) and inositol-requiring enzyme 1 alpha (Ire1α) markers. Electroretinograms amplitudes were slightly reduced and latencies increased with time in Wfs1-/- mice. Similarly, VEPs showed decreased N+P amplitudes and increased N-wave latency. Analysis of unfolded protein response signaling revealed an activation of endoplasmic reticulum stress in Wfs1-/- mutant mouse retinas. Altogether, progressive VEPs alterations with minimal neuronal cell loss suggest functional alteration of the action potential in the Wfs1-/- optic pathways.


Conflict of interest statement

Competing Interests: The authors have declared that no competing interests exist.

Figures

Figure 1
Figure 1. Photoreceptor and inner retinal functions in Wfs1 −/− mice.
Photoreceptor and inner retina electroretinogram data are presented in panels A and B, from ERG a- and b-wave respectively, on Wfs1 +/+ and −/− mice. Both waves are represented by mean values of amplitudes and latencies at the ages of 3 (n = 10 Wfs1 +/+, n = 8 Wfs1 −/−), 6 (n = 8 Wfs1 +/+, n = 7 Wfs1 −/−), 9 (n = 12 Wfs1 +/+, n = 14 Wfs1 −/−) and 12 months (n = 10 Wfs1 +/+, n = 10 Wfs1 −/−) in scotopic and mesopic conditions. Black and red traces correspond to Wfs1+/+ and Wfs1−/− animals respectively. Statistical significance is indicated when p<0.05 (*) and 0.01 (**).
Figure 2
Figure 2. Light-induced electric conduction from retina to visual cortex.
Visual evoked potentials measured from 3 to 12 months are depicted as average +/− SEM of N+P amplitudes (A) and N- and P-wave latencies (B). Black circles and red squares correspond respectively to Wfs1 +/+ and Wfs1 −/− animals. Statistical significance is indicated when p<0.05 (*) and 0.01 (**). For 3 and 6 months n = 9 for Wfs1 +/+ and Wfs1 −/−, for 9 months n = 13 Wfs1 +/+ and n = 20 Wfs1 −/−, for 12 months n = 14 Wfs1 +/+ and n = 9 Wfs1 −/−.
Figure 3
Figure 3. Behavioral analysis of subcortical vision.
Visual acuity (A) and contrast sensitivity (B) measured by the visual optomotor task are shown as averages +/− SEM at 3, 6, 9 and 12 months. Black and red traces correspond respectively to Wfs1 +/+ and Wfs1 −/− animals. Significance (*) is indicated when p<0.05. For visual acuity: for 3 months animals n = 11 Wfs1 +/+ and n = 13 Wfs1 −/−, for 6 months n = 12 Wfs1 +/+ and n = 14 Wfs1 −/−, for 9 months n = 10 Wfs1 +/+ and n = 7 Wfs1 −/−, for 12 months n = 15 Wfs1 +/+ and n = 10 Wfs1 −/−. For contrast sensitivity: for 3 months animals n = 9 Wfs1 +/+ and n = 13 Wfs1 −/−, for 6 months n = 9 Wfs1 +/+ and n = 9 Wfs1 −/−, for 9 months n = 11 Wfs1 +/+ and n = 7 Wfs1−/−, for 12 months n = 15 Wfs1 +/+ and n = 9 Wfs1 −/−.
Figure 4
Figure 4. RGC axons at the optic disc and in the optic nerves.
Representative eye fundus of 12 month old Wfs1+/+ and Wfs1 −/− mice, focused on the optic disc (A). TEM pictures of ON transversal sections from 12 month old Wfs1+/+ and Wfs1 −/− mice (B). RGC axonal densities counted in TEM pictures (C). Average values are presented +/− SEM. (n = 3 Wfs1 +/+, n = 4 Wfs1 −/−).
Figure 5
Figure 5. RGC cell density in Wfs1 −/− mice.
Brn3a and total nuclei were counted in nerve fiber layer of 12 month retinal sections (A). RGC cell density is given as average Brn3a cell nuclei in 1000 pixel segments of retina (B). Thy1 and Nrn1 relative gene expressions were quantified in retinal tissue at 3 (n = 4 Wfs1 +/+, n = 4 Wfs1 −/−), 7 (n = 5 Wfs1 +/+, n = 7 Wfs1 −/−) and 12 months (n = 8 Wfs1 +/+, n = 8 Wfs1 −/−) (C). Average values are presented +/− SEM, with statistical significance (*) indicated if p<0.05.
Figure 6
Figure 6. Retinal ER stress and UPR evaluation in Wfs1−/− mice.
Immunoblots (A) detected GRP78/BiP, PDI, IRE1, and beta actin in protein lysates of 12 month old Wfs1+/+ (n = 3) and Wfs1−/− (n = 3) mouse retinas and in mouse NIH3T3 fibroblasts treated with thapsigargin. Mean relative quantities for each protein according to Wfs1 genotype were obtained after normalization with beta actin values. Significance (*) is indicated when p<0.05.
Figure 7
Figure 7
P-Ire1α activation correlates with WFS1 cell expression. Cryosections of retina from 12 month old Wfs1+/+ and Wfs1−/− mouse were immunostained with anti-WFS1 antibody (green in top image) and NF200 (red in top image) or anti-P-Ire1α antibody (red in bottom image). DAPI was used for staining of cell nuclei (blue). RPE, retinal pigment epithelium; ONL, outer nuclear layer; INL, inner nuclear layer, RGC, retinal ganglion cells. Scale bars = 50 µm.

Similar articles

Cited by

References

    1. Barrett TG, Bundey SE, Macleod AF (1995) Neurodegeneration and diabetes: UK nationwide study of Wolfram (DIDMOAD) syndrome. Lancet 346: 1458–1463. - PubMed
    1. Barrett TG, Bundey SE, Fielder AR, Good PA (1997) Optic atrophy in Wolfram (DIDMOAD) syndrome. Eye (Lond) 11 (Pt 6): 882–888. - PubMed
    1. Rando RA, Horton JC, Layzer RB (1992) Wolfram syndrome: evidence of a diffuse neurodegenerative disease by magnetic resonance imaging. Neurology 42: 1220–1224. - PubMed
    1. Wolfram DJ, Wagener HP (1938) Diabetes mellitus and simple optic atrophy among siblings: report of four cases. Mayo Clin Proc 9: 715–718.
    1. Swift RG, Polymeropoulos MH, Torres R, Swift M (1998) Predisposition of Wolfram syndrome heterozygotes to psychiatric illness. Mol Psychiatry 3: 86–91. - PubMed

Publication types

MeSH terms

LinkOut - more resources