

Fold rise in antibody titers by measured by glycoprotein-based enzyme-linked immunosorbent assay is an excellent correlate of protection for a herpes zoster vaccine, demonstrated via the vaccine efficacy curve
- PMID: 24823623
- PMCID: PMC4215071
- DOI: 10.1093/infdis/jiu279
Fold rise in antibody titers by measured by glycoprotein-based enzyme-linked immunosorbent assay is an excellent correlate of protection for a herpes zoster vaccine, demonstrated via the vaccine efficacy curve
Abstract
Background: The phase III Zostavax Efficacy and Safety Trial of 1 dose of licensed zoster vaccine (ZV; Zostavax; Merck) in 50-59-year-olds showed approximately 70% vaccine efficacy (VE) to reduce the incidence of herpes zoster (HZ). An objective of the trial was to assess immune response biomarkers measuring antibodies to varicella zoster virus (VZV) by glycoprotein-based enzyme-linked immunosorbent assay as correlates of protection (CoPs) against HZ.
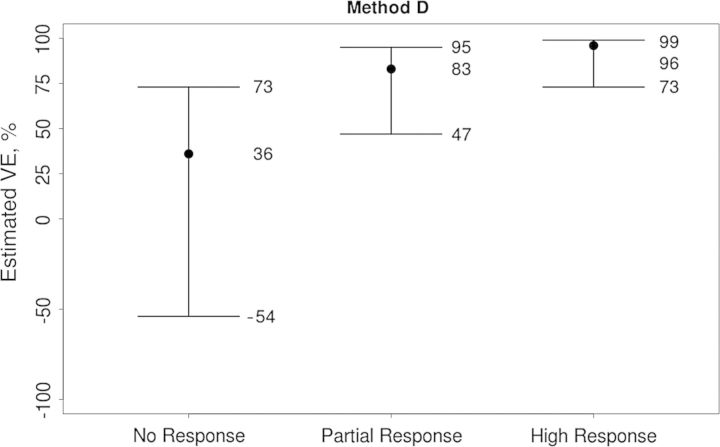
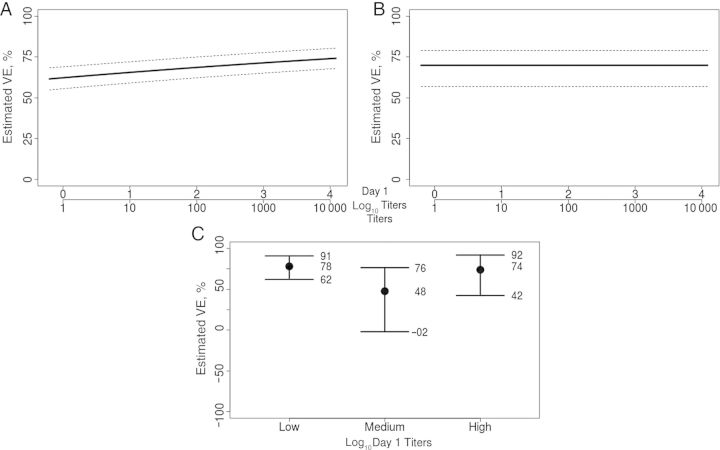
Methods: The principal stratification vaccine efficacy curve framework for statistically evaluating immune response biomarkers as CoPs was applied. The VE curve describes how VE against the clinical end point (HZ) varies across participant subgroups defined by biomarker readout measuring vaccine-induced immune response. The VE curve was estimated using several subgroup definitions.
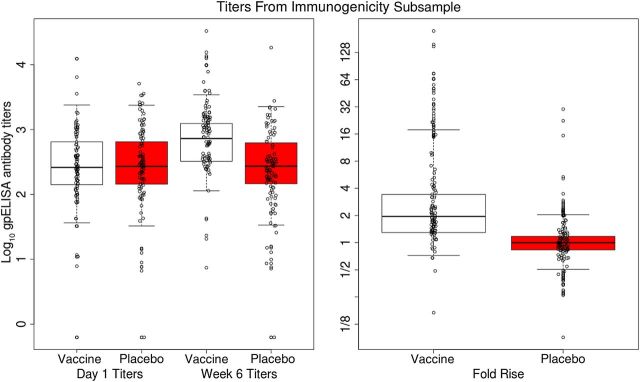
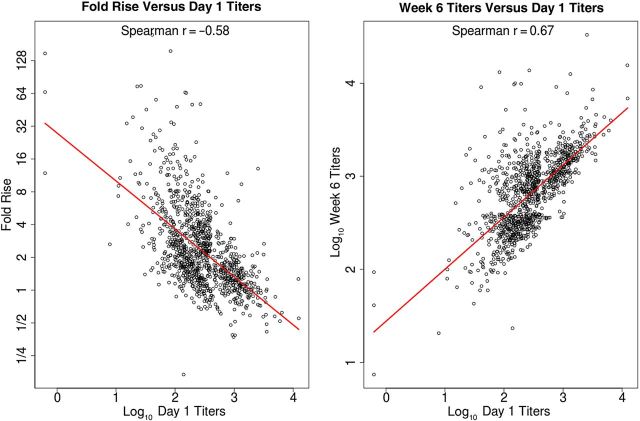
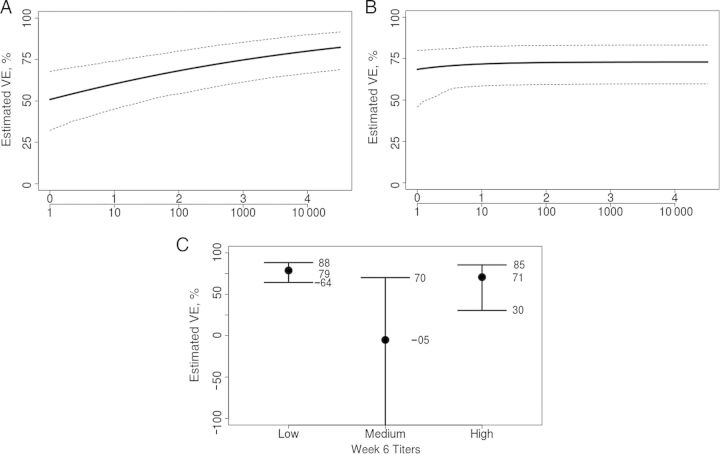
Results: The fold rise in VZV antibody titers from the time before immunization to 6 weeks after immunization was an excellent CoP, with VE increasing sharply with fold rise: VE was estimated at 0% for the subgroup with no rise and at 90% for the subgroup with 5.26-fold rise. In contrast, VZV antibody titers measured 6 weeks after immunization did not predict VE, with similar estimated VEs across titer subgroups.
Conclusions: The analysis illustrates the value of the VE curve framework for assessing immune response biomarkers as CoPs in vaccine efficacy trials.
Clinical trials registration: NCT00534248.
Keywords: causal inference; correlate of immunity; immune correlate of protection; principal stratification; signature of protection; statistical analysis; surrogate endpoint; vaccine efficacy trial.
© The Author 2014. Published by Oxford University Press on behalf of the Infectious Diseases Society of America. All rights reserved. For Permissions, please e-mail: journals.permissions@oup.com.
Figures

Comment in
-
Assessing correlates of protection in vaccine trials.J Infect Dis. 2014 Nov 15;210(10):1523-5. doi: 10.1093/infdis/jiu283. Epub 2014 May 13. J Infect Dis. 2014. PMID: 24823622 No abstract available.
-
Correlates of Protection for Herpes Zoster Vaccine: Evaluating Candidate Immunological Variables.J Infect Dis. 2015 Nov 1;212(9):1521. doi: 10.1093/infdis/jiv286. Epub 2015 May 17. J Infect Dis. 2015. PMID: 25985903 No abstract available.
-
Reply to Dunning.J Infect Dis. 2015 Nov 1;212(9):1521-3. doi: 10.1093/infdis/jiv287. Epub 2015 May 17. J Infect Dis. 2015. PMID: 25985906 Free PMC article. No abstract available.
References
-
- Gnann JW, Jr, Whitley RJ. Clinical practice. Herpes zoster. N Engl J Med. 2002;347:340–6. - PubMed
-
- Katz J, Cooper EM, Walther RR, Sweeney EW, Dworkin RH. Acute pain in herpes zoster and its impact on health-related quality of life. Clin Infect Dis. 2004;39:342–8. - PubMed
-
- Schmader KE, Sloane R, Pieper C, et al. The impact of acute herpes zoster pain and discomfort on functional status and quality of life in older adults. Clin J Pain. 2007;23:490–6. - PubMed
Publication types
MeSH terms
Substances
Associated data
Grants and funding
LinkOut - more resources
Full Text Sources
Other Literature Sources
Medical
