. 2014 May 12;25(5):621-37.
doi: 10.1016/j.ccr.2014.03.014.

Oncogenic Kras activates a hematopoietic-to-epithelial IL-17 signaling axis in preinvasive pancreatic neoplasia

Affiliations

Oncogenic Kras activates a hematopoietic-to-epithelial IL-17 signaling axis in preinvasive pancreatic neoplasia

Florencia McAllister et al. Cancer Cell. .

Abstract

Many human cancers are dramatically accelerated by chronic inflammation. However, the specific cellular and molecular elements mediating this effect remain largely unknown. Using a murine model of pancreatic intraepithelial neoplasia (PanIN), we found that Kras(G12D) induces expression of functional IL-17 receptors on PanIN epithelial cells and also stimulates infiltration of the pancreatic stroma by IL-17-producing immune cells. Both effects are augmented by associated chronic pancreatitis, resulting in functional in vivo changes in PanIN epithelial gene expression. Forced IL-17 overexpression dramatically accelerates PanIN initiation and progression, while inhibition of IL-17 signaling using genetic or pharmacologic techniques effectively prevents PanIN formation. Together, these studies suggest that a hematopoietic-to-epithelial IL-17 signaling axis is a potent and requisite driver of PanIN formation.


Figures

Figure 1
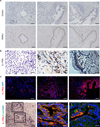
Figure 1. Human pancreatic cancer precursor lesions are infiltrated by IL-17-producing T cells and over-express the IL-17 Receptor A
(A) Representative sections of RORγt+ cells infiltrating human ADM (left panel), early PanIN (middle panel) and advanced PanIN (right panel). Control sections treated with secondary antibody alone and with hematoxylin for morphological reference are shown on the top panels. Scale bars indicate 50 µm. (B) Immunohistochemical detection of IL-17RA in normal acinar tissue (left panel, scale bar = 50 µm), ADMs (middle panel, scale bar = 100 µm) and PanIN lesion (right panel, scale bar = 150 µm). (C) Immunofluorescent detection of IL-17RA on human ADMs (left panel), early PanIN (middle panel) and advanced PanIN (right panel). Scale bars indicate 50 µm. (D) H&E staining of human tissue containing transitional elements comprised of both ADM and PanIN. Scale bars indicate 50 µm. (E, F) Immunofluorescent detection of IL-17RA on a PanIN (E) and on a transitional ADM (F). Scale bars indicate 150 µm. See also Figure S1.
Figure 2
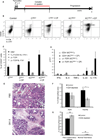
Figure 2. Oncogenic Kras and chronic pancreatitis synergistically recruit TH17 and IL-17+ YδT-cells to the PanIN microenvironment
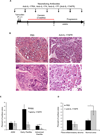
(A) Protocol followed for tamoxifen-mediated KrasG12D activation and cerulein-mediated induction of chronic pancreatitis in KCiMist1 and CiMist1 mice. (B) Flow cytometry dot plots for dual labeling of CD45 and intracellular IL-17A on dispersed pancreatic cells from the indicated mice. Numbers inside the plots indicate numbers of CD45+/IL-17A+ double positive cells quantified as percent of total live gated cells. Control flow chart (Left) represents pancreatic cells from a KCiMist−1 mouse stained for CD45 only. (C) Quantification of CD4+ T cells, γδT cells and their double staining with intracellular IL-17A from the indicated mice. TH17 cells were defined as CD45+/IL-17A+ cells. Results are shown as percent of CD45+ cells ± SEM (n=3–4). (D) RT-PCR based quantification of IFNγ, IL-4, TNFα, IL-22 and IL-17A in CD4+ and γδT cells sorted by FACS from the pancreas of KCiMist1 and KCiMist1+ CP mice. Data was normalized to CiMist1 + CP mice and results were presented as relative expression of cytokines/ sorted cell. SEM from triplicates are shown. (E) Representative H&E staining of pancreatic tissue sections from KCiMist1+ CP mice that received PBS or GK1.5 injections at 7 weeks after Kras activation. Scale bars indicate 70 µm. (F, G) Tridimensional quantification of fractional cross sectional area occupied by ADMs or PanINs (F) or occupied by fibro-inflammatory stroma or normal tissue (G) in KCiMist1 that received PBS or GK1.5 injection. Results are shown as mean ± SEM (n=4), (*p < 0.05; NS: No statistical significance). See also Figure S2.
Figure 3
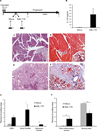
Figure 3. Pancreatic over-expression of IL-17A results in increased tumor initiation and progression
(A) Protocol for Kras activation and delivery of adenovirus to KCiMist1 mouse pancreas. (B) ELISA-based quantification of IL-17A production by dispersed pancreatic cells isolated 1 week following injection of the indicated adenovirus. Results are shown as mean concentration ± SEM (n=4). (C–F). Representative H&E (C, E) or Masson's trichrome (D, F) staining of pancreatic tissue harvested from KCiMist1 mice injected with AdLuc (C, D) or AdIL-17A (E, F) at 7 weeks after Kras activation. Scale bars indicate 70 µm. (G, H) Quantification of fractional cross sectional area occupied by ADM, early PanIN, or advanced PanIN (G) or occupied by fibro-inflammatory stroma or normal tissue (H) in KCiMist1 mice infected with AdLuc vs. AdIL-17A. Results are shown as mean ± SEM (n=9–10), (*p < 0.05; **p < 0.01). See also Figure S3.
Figure 4
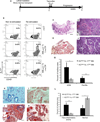
Figure 4. Genetic ablation of IL-17A within the hematopoietic compartment results in delayed PanIN initiation and progression
(A) Protocol for the generation of KCiMist−1/IL-17AWT BM and KCiMist−1/IL-17AKO BM chimeric animals. (B) Eight weeks following lethal irradiation and BM transplantation as indicated, splenocytes were cultured in TH17 polarization conditions and re-stimulated with PMA/Ionomycin. Bone marrow chimerism was assessed by flow cytometry on polarized splenocytes labeled for cell surface CD45 and intracellular IL-17A. Double-positive cells were quantified and results expressed as percent of total splenocytes. (C–F) Representative H&E staining on pancreatic tissue sections from KCMist−1/IL-17AWT BM (C, D) and KCiMist−1/IL-17AKO BM (E, F) mice at 8 weeks following KrasG12D activation. (G) Quantification of fractional cross sectional area occupied by ADM or PanIN in the panreas of indicated mice. Results are shown as mean ± SEM (n=5–7) (*p < 0.05; **p < 0.01). (H, I) Alcian blue staining for mucins on pancreatic tissue sections from KCiMist−1/IL-17AWT BM (H) and KCiMist−1/IL-17AKO BM (I) mice. (J, K) Masson’s trichrome staining for collagen deposition in pancreas from KCiMist−1/IL-17AWT BM (J) and KCiMist−1/IL-17AKO BM (K) mice. (L) Quantification of fractional cross sectional area occupied by fibro-inflammatory stroma or normal tissue in the pancreas of indicated mice. Results are shown as mean ± SEM (n=5–7) (*p < 0.05; **p < 0.01). Scale bars in C and E indicate 400 µm; scale bars in D, F, H, I indicate 80 µm; scale bars in J, K indicate 40 µm. See also Figure S4.
Figure 5
Figure 5. Pharmacological neutralization of IL-17 pathway results in delayed initiation and progression of PanINs
(A) Protocol followed for induction of KrasG12D expression and administration of IL-17 pathway neutralizing antibodies to KCiMist1 mice. (B) Representative H&E staining on pancreatic tissue sections from KCiMist1 mice that received IL-17RA, IL-17A and IL-17F neutralizing antibodies or PBS injection at 7 weeks after Kras activation. Scale bars indicate 80 µm for top panels, 40 µm for bottom panels. (C, D) Quantification of fractional cross sectional area occupied by ADMs or PanINs (C) or occupied by fibro-inflammatory stroma or normal tissue (D) in KCiMist1 that received PBS injections (black bars) vs. KCiMist1 that received the combination of IL-17RA, IL-17A and IL-17F neutralizing antibodies (grey bars). Results are shown as mean ± SEM (n=4–5), (*p < 0.05; **p < 0.01). See also Figure S5.
Figure 6
Figure 6. Oncogenic Kras activates IL-17 receptor A (IL-17RA) expression in early PanIN epithelium
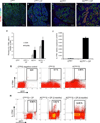
(A–D) Immunofluorescent detection of IL-17RA expression (red) on pancreatic epithelium in CiMist1 normal pancreas (A), CiMist1 pancreas with associated chronic pancreatitis (B), KCiMist1 pancreas at 8 weeks following Kras activation (C), and KCiMist1 with chronic pancreatitis at 6 weeks following Kras activation (D). Slides were co-labeled with anti-E-cadherin antibody (green) and DAPI nuclear marker (blue). Red arrow indicates IL-17R staining in stroma. Scale bars indicate 80 µm. (E) Quantification of IL-17RA expressing cells, expressed as percent of all E-cadherin+ cells in ADM or PanIN lesions. Results are shown as mean ± SEM. Multiple lesions (ADMs and PanINs) from 5 mice were quantified (*p < 0.05; **p < 0.01). (F) Relative expression of IL-17RA quantified by Taqman RT-PCR on GFP+ cells sorted from CiMist1 mice versus KCiMist−1 mice. Results are shown as mean ± SEM (n=3). (G) FACS-based quantification of cells expressing cell surface IL-17RA in combination with GFP as a marker of effective Cre-based recombination in mice 8 weeks post oncogenic Kras activation. The “CiMist1G negative control” panel depicts cells harvest from CiMist1G control mice receiving no tamoxifen labeled with secondary antibody only; these cells were used to establish subsequently utilized GFP and IL-17RA gates. Propidium Iodide staining was used to exclude non-viable cells. (H) FACS-based quantification of cells expressing cell surface IL-17RA in combination with GFP following oncogenic Kras activation and CP. Propidium Iodide staining was used to exclude non-viable cells. For clarity, only the GFP+ fraction is depicted in the FACS plots. Results are expressed as percent of total GFP+ cells. See also Figure S6.
Figure 7
Figure 7. KrasG12- induced activation of IL-17RA expression on PanIN epithelial cells is associated with in vivo functional responses to IL-17A
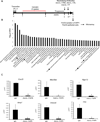
(A) Protocol followed for induction of KrasG12D expression in KCiMist1G mice followed by delayed treatment with IL-17 signaling neutralizing antibodies and subsequent FACS-isolation of GFP+ PanIN epithelial cells for microarray. (B) Top Ingenuity Canonical Pathways enriched among genes that were significantly down-regulated in GFP+ cells sorted from KCiMist1G mice treated with IL-17 signaling neutralizing antibodies. As indicated on Y-axis, pathways are sorted based on p value. Arrows indicate pathways directly related to IL-17 signaling. (C) Relative expression of representative genes quantified by Taqman RT-PCR. Results are shown as mean ± SEM (n=3), (*p < 0.05; **p < 0.01). See also Table S1.
Figure 8
Figure 8. IL-17 neutralization is associated with decreased IL-6/ p-Stat3 epithelial activation
(A) Relative expression of Il6 in GFP+ cells sorted from KCiMist1G mice treated for 1 week with IL-17 signaling neutralizing antibodies. Results are shown as mean ± SEM (n=4), (*p < 0.05; **p < 0.01). (B) Relative expression of Il6 in pancreatic whole tissue from KCiMist/IL-17WBM vs. KCiMist/IL-17WT mice. Results were presented as relative expression of Il6 (2-DCT). Results are shown as mean ± SEM (n=4), (*p < 0.05). (C) Immunohistochemistry for phosphorylated Stat3 (pStat3) in dysplastic pancreatic epithelium of KCiMist/IL-17WT BM vs. KCiMist/IL-17KO mice (bottom panel). Scale bars in top panels represent: 80 µm. Bottom panels are showing detailed dysplastic epithelium from top panels.

Comment in

Similar articles

Cited by

References

    1. Bailey JM, Alsina J, Rasheed ZA, McAllister FM, Fu YY, Plentz R, Zhang H, Pasricha PJ, Bardeesy N, Matsui W, et al. DCLK1 Marks a Morphologically Distinct Subpopulation of Cells with Stem Cell Properties in Pre-invasive Pancreatic Cancer. Gastroenterology. 2013 - PMC - PubMed
    1. Bailey JM, Leach SD. Signaling pathways mediating epithelial- mesenchymal crosstalk in pancreatic cancer: Hedgehog, Notch and TGFbeta. In: Grippo PJ, Munshi HG, editors. Pancreatic Cancer and Tumor Microenvironment. Trivandrum (India): 2012. - PubMed
    1. Bayne LJ, Beatty GL, Jhala N, Clark CE, Rhim AD, Stanger BZ, Vonderheide RH. Tumor-derived granulocyte-macrophage colony-stimulating factor regulates myeloid inflammation and T cell immunity in pancreatic cancer. Cancer cell. 2012;21:822–835. - PMC - PubMed
    1. Braun RK, Ferrick C, Neubauer P, Sjoding M, Sterner-Kock A, Kock M, Putney L, Ferrick DA, Hyde DM, Love RB. IL-17 producing gammadelta T cells are required for a controlled inflammatory response after bleomycin-induced lung injury. Inflammation. 2008;31:167–179. - PubMed
    1. Chaturvedi P, Singh AP, Moniaux N, Senapati S, Chakraborty S, Meza JL, Batra SK. MUC4 mucin potentiates pancreatic tumor cell proliferation, survival, and invasive properties and interferes with its interaction to extracellular matrix proteins. Molecular cancer research : MCR. 2007;5:309–320. - PubMed

Publication types

MeSH terms

Substances

Associated data