. 2014 May 12;25(5):638-651.
doi: 10.1016/j.ccr.2014.03.017.

Cross-species regulatory network analysis identifies a synergistic interaction between FOXM1 and CENPF that drives prostate cancer malignancy

Affiliations

Cross-species regulatory network analysis identifies a synergistic interaction between FOXM1 and CENPF that drives prostate cancer malignancy

Alvaro Aytes et al. Cancer Cell. .

Abstract

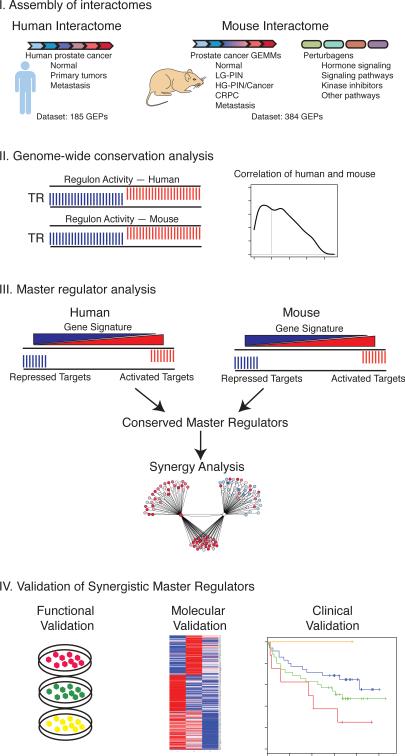
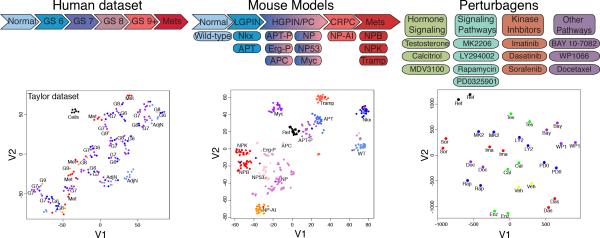
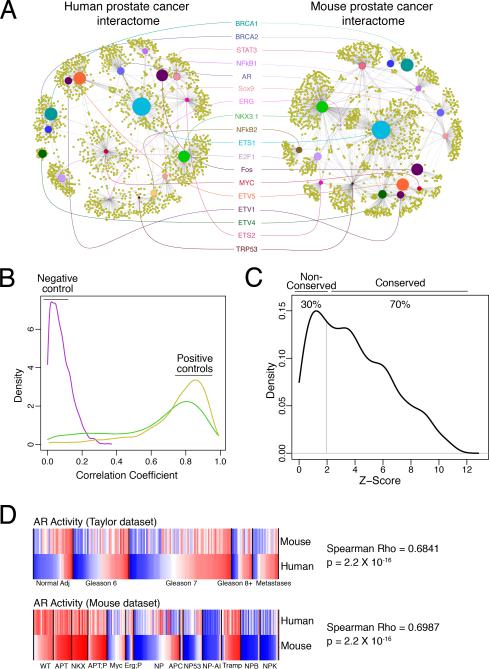
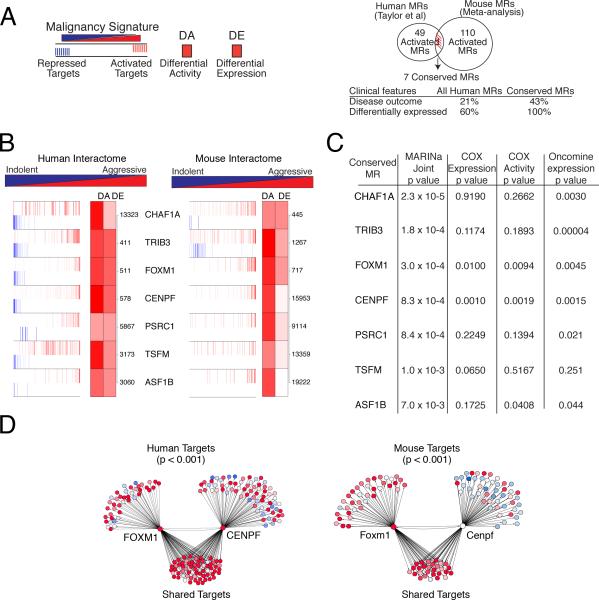
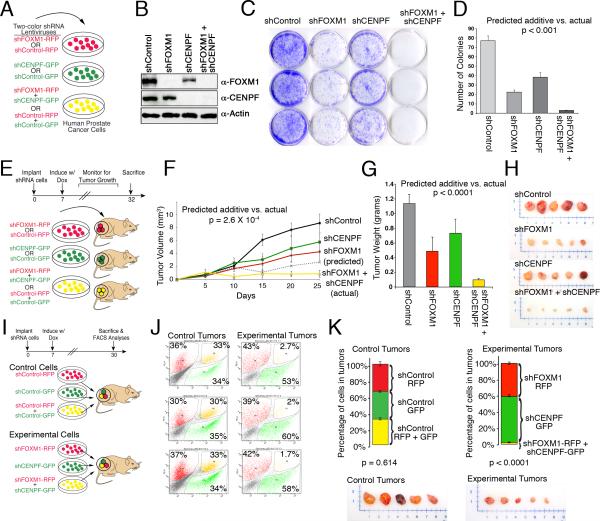
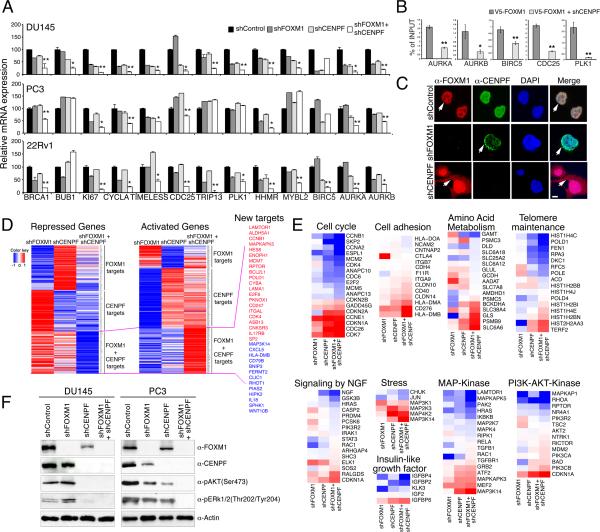
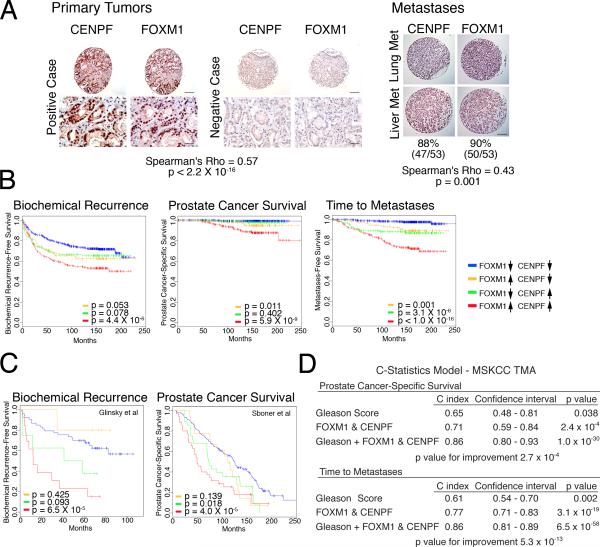
To identify regulatory drivers of prostate cancer malignancy, we have assembled genome-wide regulatory networks (interactomes) for human and mouse prostate cancer from expression profiles of human tumors and of genetically engineered mouse models, respectively. Cross-species computational analysis of these interactomes has identified FOXM1 and CENPF as synergistic master regulators of prostate cancer malignancy. Experimental validation shows that FOXM1 and CENPF function synergistically to promote tumor growth by coordinated regulation of target gene expression and activation of key signaling pathways associated with prostate cancer malignancy. Furthermore, co-expression of FOXM1 and CENPF is a robust prognostic indicator of poor survival and metastasis. Thus, genome-wide cross-species interrogation of regulatory networks represents a valuable strategy to identify causal mechanisms of human cancer.


Figures

Figure 1
Figure 1. Strategy for genome-wide cross-species analyses of prostate cancer
Schematic representation of the overall strategy. Step I: Assembly of human and mouse prostate cancer interactomes. Step II: Genome-wide computational analysis of conservation of transcriptional regulon activity in the mouse and human prostate cancer interactomes. Step III: Master regulator analysis for identification of conserved master regulators and prediction of synergy. Step IV: Validation of candidate master regulators using functional, molecular, and clinical analyses.
Figure 2
Figure 2. Heterogeneity of human and mouse datasets used for interactome assembly
t-Distributed Stochastic Neighbor Embedding (t-SNE) analysis of human and mouse datasets used to assemble the prostate cancer interactomes. (Left) t-SNE analysis of the Taylor dataset relative to Gleason score. (Middle) Schematic representation of GEMMs used to assembly the mouse prostate cancer interactome. t-SNE analysis showing relative distribution of the GEMMs. (Right) Schematic diagram depicting perturbagens used to treat the GEMMs. t-SNE analysis showing the relative distribution of perturbagens for a representative GEMM (i.e., the NP mice). See also Figure S1, Tables S1, and S2.
Figure 3
Figure 3. Genome-wide conservation analyses of the human and mouse prostate cancer interactomes
(A) ARACNe sub-networks from the human and mouse prostate cancer interactomes highlighting selected conserved transcriptional regulators. The scaled size of the transcriptional regulator nodes (colored circles) indicates the degree of conservation while the relative distance between them approximates the strength of their association. (B, C) Histograms (density plots) showing conservation of transcriptional regulator activity between the human and mouse prostate cancer interactomes. (B) Distribution of correlation coefficients of activity profiles of transcriptional regulators for randomized interactomes (negative control; purple line) and the positive control interactomes for human (yellow) and mouse (green) (Supplementary Experimental Procedures). (C) Distribution of Z-scores for conservation of activity profiles between the human and mouse interactomes at p ≤ 0.05. (D) Comparison of the androgen receptor (AR) activity levels in each sample from Taylor et al (top) and the mouse dataset(bottom) showing the Spearman correlation coefficient. See also Tables S3, Table S4, and Table S5.
Figure 4
Figure 4. Conserved master regulators of malignant prostate cancer
(A) (left) Master regulators (MRs) were identified using human or mouse interactomes malignancy signatures; differential activity (DA) is based on enrichment of activated (red) and repressed (blue) targets. DE, differential expression. (Right) Venn diagram showing integration of independent lists of activated MRs from human (49) and mouse (110) with an overlap of 7 conserved MRs. Clinical features of all human MRs versus the conserved MRs showing the percentage associated with disease outcome (using a COX proportional hazard model) and the percentage that are differentially-expressed in advanced prostate cancer (from Oncomine). (B) Conserved activated MRs are shown for the human (left) and mouse (right) malignancy signatures, depicting their positive (activated; red bars) and negative (repressed; blue bars) targets. The ranks of differential activity (DA) and differential expression (DE) are shown by the shaded boxes; the numbers indicate the rank of the DE in the malignancy signature. (C) Summary of conserved MRs showing: joint p value from human and mouse MARINa analysis, calculated using Stouffer's method; p value for COX proportional hazard regression model applied to mRNA expression levels and predicted MR activity; and average p values for differential expression of MRs in metastatic versus non-metastatic primary tumors. (D) Computational synergy analysis depicting FOXM1 and CENPF regulons from the human (left) and mouse (right) interactomes showing shared and non-shared targets. Red corresponds to over-expressed targets and blue to under-expressed targets; the p value for the enrichment of shared targets is shown. See also Figure S2, Tables S6 and S7
Figure 5
Figure 5. Functional validation of FOXM1 and CENPF
(A) Human prostate cancer cells were infected with lentiviral silencing vectors expressing shRNA for FOXM1 and/or CENPF (or control) and either an RFP (red) or GFP (green) reporter. Unless otherwise indicated, analyses were done using two independent shRNAs for each gene and in four independent prostate cancer cell lines (DU145, PC3, LNCaP, 22Rv1); in most cases data using shRNA1 are shown. (B) Western blot analysis showing expression of FOXM1 or CENPF proteins in DU145 cells with the indicated shRNAs. (C, D) Colony formation assay. (C) representative analyses of DU145 cells with an shRNA for FOXM1 and/or CENPF (or the control) with colonies visualized using crystal violet. (D) quantification of colonies using ImageJ. (E-H) Analysis of tumor growth in vivo. (E) DU145 cells expressing an shRNA for FOXM1 and/or CENPF, or the control, were implanted subcutaneously into mouse hosts. Beginning on day 7, mice were administered doxycycline to induce shRNA expression and tumor growth was monitored for one month. (F) Tumor growth curves for the indicated shRNA. The dashed line shows the predicted additive effect of co-silencing FOXM1 and/or CENPF. (G) Tumor weights at the time of sacrifice. (H) Representative tumors. In panels D, F, and G the predicted additive was estimated based on the consequences of individual silencing of FOXM1 and CENPF using a log linear model; the p value, calculated using a one-sample t-test, indicates the significance between the predicted additive versus the actual (observed) consequences of co-silencing FOXM1 and CENPF. (I-L) In vivo competition assay. (I) Equal numbers of DU145 cells expressing the control shRNA (control cells), or the experimental shRNA for FOXM1 and/or CENPF (experimental cells) as well as RFP or GFP were implanted into mouse hosts. Beginning on day 7, mice were administered doxycycline to induce shRNA expression and tumor growth was monitored for one month. Following which, tumors were collected and FACS-sorted to quantify the total number of red, green, or yellow cells in individual tumors for control and experimental groups. (J) Representative FACS plots showing the percentage of red, green or yellow cells relative to the total number of fluorescent cells. (K) (Top) Graphs show the average percent of red, green, and yellow cells in the control tumors (n = 4) or experimental tumors (n = 7); p values correspond to a Hotelling's one-sample t-test. (Bottom) Representative tumors. Error bars represent +/- SD. See also Figure S3.
Figure 6
Figure 6. FOXM1 and CENPF synergistically regulate gene expression and control tumorigenic signaling pathways in prostate cancer
(A) Validation of ARACNe-inferred shared targets of FOXM1 and CENPF. The graphs show relative mRNA expression levels, normalized to GADPH, for the indicated genes in the cell lines shown following individual or co-silencing of FOXM1 and CENPF. The p values (indicated by *) show the significance of the predicted additive effect versus actual effect on gene expression calculated using a one-sample t-test (*, p <0.01; **, p <0.001). (B) Chromatin immunoprecipitation (ChIP) followed by qPCR of genomic binding sites of FOXM1. Cells were infected with a lentivirus expressing V5-tagged FOXM1 as well as an shRNA for CENPF (or a control) and ChIP was done using an anti-V5 antibody. Data are expressed as fold enrichment of FOXM1 binding normalized to input. (C) Subcellular localization of FOXM1 and CENPF in prostate cancer cells after silencing. Shown are microphotographs of immunofluorescence staining for FOXM1 or CENPF in the control or silenced cells as indicated. Arrows indicate subcellular localization. Scale bars represent 1 μm. (D-E) Consequences of silencing FOXM1 and/or CENPF for gene expression profiling in DU145 cells. (D) Heatmaps of differentially expressed genes. Colors correspond to levels of differential expression; red corresponds to over-expression and blue to under-expression. Selected genes differentially expressed following co-silencing are indicated. (E) Heatmaps showing leading edge genes of biological pathways enriched by co-silencing of FOXM1 and CENPF as assessed by GSEA. (F) Western blot analyses showing expression of the indicated markers of the PI3-kinase and MAP kinase signaling pathways in DU145 and PC3 prostate cancer cells silenced for FOXM1 and/or CENPF,as indicated. Error bars represent +/- SD. See also Figure S4; Tables S8 and S9.
Figure 7
Figure 7. Clinical validation of FOXM1 and CENPF in human prostate cancer
(A) Analysis of tissue microarrays (TMAs). Representative images from the MSKCC prostatectomy TMA and the Michigan metastasis TMA showing FOXM1 and CENPF protein expression; Spearman correlation of their co-expression with p value is shown. Scale bars represent 10 μm (lower Primary Tumor) or 100 μm (all others). (B) Kaplan-Meier survival analysis based on protein expression levels of FOXM1 and CENPF in MSKCC prostatectomy TMA with respect to time to biochemical recurrence, time to prostate cancer-specific death, or time to metastatic progression. (C) Kaplan-Meier survival analysis based on the ARACNe-inferred activity levels of FOXM1 and CENPF (Supplementary Experimental Procedures) in two independent human prostate cancer datasets using biochemical recurrence-free survival (Glinsky et al., 2004) or prostate cancer-specific survival (Sboner et al., 2010) as disease endpoints. In panels B and C, the p values correspond to a log-rank test and indicate the statistical significance of the association with outcome for each indicated branch compared to control (i.e., patients with low activity levels of both FOXM1 and CENPF, blue line curve). (D) C-statistics analysis, based on the protein levels of FOXM1 and CENPF from the MSKCC TMA, using death due to prostate cancer and time to metastasis as evaluation endpoints. See also Figure S5

Comment in

References

    1. Akavia UD, Litvin O, Kim J, Sanchez-Garcia F, Kotliar D, Causton HC, Pochanard P, Mozes E, Garraway LA, Pe'er D. An integrated approach to uncover drivers of cancer. Cell. 2010;143:1005–1017. - PMC - PubMed
    1. Alvarez-Fernandez M, Medema RH. Novel functions of FoxM1: from molecular mechanisms to cancer therapy. Frontiers in oncology. 2013;3:30. - PMC - PubMed
    1. Aytes A, Mitrofanova A, Kinkade CW, Lefebvre C, Lei M, Phelan V, LeKaye HC, Koutcher JA, Cardiff RD, Califano A, et al. ETV4 promotes metastasis in response to activation of PI3-kinase and Ras signaling in a mouse model of advanced prostate cancer. Proc Natl Acad Sci U S A. 2013;110:E3506–3515. - PMC - PubMed
    1. Baca SC, Prandi D, Lawrence MS, Mosquera JM, Romanel A, Drier Y, Park K, Kitabayashi N, MacDonald TY, Ghandi M, et al. Punctuated evolution of prostate cancer genomes. Cell. 2013;153:666–677. - PMC - PubMed
    1. Basso K, Margolin AA, Stolovitzky G, Klein U, Dalla-Favera R, Califano A. Reverse engineering of regulatory networks in human B cells. Nat Genet. 2005;37:382–390. - PubMed

Publication types

MeSH terms

Substances

Associated data