Simulation of population-based commuter exposure to NO₂ using different air pollution models
- PMID: 24823664
- PMCID: PMC4053908
- DOI: 10.3390/ijerph110505049
Simulation of population-based commuter exposure to NO₂ using different air pollution models
Abstract
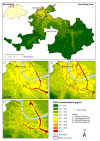
We simulated commuter routes and long-term exposure to traffic-related air pollution during commute in a representative population sample in Basel (Switzerland), and evaluated three air pollution models with different spatial resolution for estimating commute exposures to nitrogen dioxide (NO2) as a marker of long-term exposure to traffic-related air pollution. Our approach includes spatially and temporally resolved data on actual commuter routes, travel modes and three air pollution models. Annual mean NO2 commuter exposures were similar between models. However, we found more within-city and within-subject variability in annual mean (±SD) NO2 commuter exposure with a high resolution dispersion model (40 ± 7 µg m(-3), range: 21-61) than with a dispersion model with a lower resolution (39 ± 5 µg m(-3); range: 24-51), and a land use regression model (41 ± 5 µg m(-3); range: 24-54). Highest median cumulative exposures were calculated along motorized transport and bicycle routes, and the lowest for walking. For estimating commuter exposure within a city and being interested also in small-scale variability between roads, a model with a high resolution is recommended. For larger scale epidemiological health assessment studies, models with a coarser spatial resolution are likely sufficient, especially when study areas include suburban and rural areas.
Figures


Similar articles
-
The relevance of commuter and work/school exposure in an epidemiological study on traffic-related air pollution.J Expo Sci Environ Epidemiol. 2015 Sep-Oct;25(5):474-81. doi: 10.1038/jes.2014.83. Epub 2014 Dec 10. J Expo Sci Environ Epidemiol. 2015. PMID: 25492241
-
Mortality and Morbidity Effects of Long-Term Exposure to Low-Level PM2.5, BC, NO2, and O3: An Analysis of European Cohorts in the ELAPSE Project.Res Rep Health Eff Inst. 2021 Sep;2021(208):1-127. Res Rep Health Eff Inst. 2021. PMID: 36106702 Free PMC article.
-
Comparison of spatiotemporal prediction models of daily exposure of individuals to ambient nitrogen dioxide and ozone in Montreal, Canada.Environ Res. 2017 Jul;156:201-230. doi: 10.1016/j.envres.2017.03.017. Epub 2017 Mar 28. Environ Res. 2017. PMID: 28359040
-
Methods for Assessing Long-Term Exposures to Outdoor Air Pollutants.Curr Environ Health Rep. 2017 Dec;4(4):450-462. doi: 10.1007/s40572-017-0169-5. Curr Environ Health Rep. 2017. PMID: 29064065 Free PMC article. Review.
-
Assessing schoolchildren's exposure to air pollution during the daily commute - A systematic review.Sci Total Environ. 2020 Oct 1;737:140389. doi: 10.1016/j.scitotenv.2020.140389. Epub 2020 Jun 20. Sci Total Environ. 2020. PMID: 32783874
Cited by
-
Assessment of Population Exposure to Coarse and Fine Particulate Matter in the Urban Areas of Chennai, India.ScientificWorldJournal. 2015;2015:643714. doi: 10.1155/2015/643714. Epub 2015 Jul 14. ScientificWorldJournal. 2015. PMID: 26258167 Free PMC article.
-
Integrating Modes of Transport in a Dynamic Modelling Approach to Evaluate Population Exposure to Ambient NO2 and PM2.5 Pollution in Urban Areas.Int J Environ Res Public Health. 2020 Mar 22;17(6):2099. doi: 10.3390/ijerph17062099. Int J Environ Res Public Health. 2020. PMID: 32235712 Free PMC article.
-
The relevance of commuter and work/school exposure in an epidemiological study on traffic-related air pollution.J Expo Sci Environ Epidemiol. 2015 Sep-Oct;25(5):474-81. doi: 10.1038/jes.2014.83. Epub 2014 Dec 10. J Expo Sci Environ Epidemiol. 2015. PMID: 25492241
-
A pruned feed-forward neural network (pruned-FNN) approach to measure air pollution exposure.Environ Monit Assess. 2023 Sep 11;195(10):1183. doi: 10.1007/s10661-023-11814-5. Environ Monit Assess. 2023. PMID: 37695355 Free PMC article.
-
Contribution of the in-vehicle microenvironment to individual ambient-source nitrogen dioxide exposure: the Multi-Ethnic Study of Atherosclerosis and Air Pollution.J Expo Sci Environ Epidemiol. 2018 Jun;28(4):371-380. doi: 10.1038/s41370-018-0025-1. Epub 2018 Mar 6. J Expo Sci Environ Epidemiol. 2018. PMID: 29511286 Free PMC article.
References
-
- Physick W., Powell J., Cope M., Boast K., Lee S. Measurements of personal exposure to NO2 and modelling using ambient concentrations and activity data. Atmos. Environ. 2011;45:2095–2102. doi: 10.1016/j.atmosenv.2011.01.063. - DOI
-
- Morawska L., Ristovski Z., Jayaratne E.R., Keogh D.U., Ling X. Ambient nano and ultrafine particles from motor vehicle emissions: Characteristics, ambient processing and implications on human exposure. Atmos. Environ. 2008;42:8113–8138. doi: 10.1016/j.atmosenv.2008.07.050. - DOI
-
- Knibbs L.D., Cole-Hunter T., Morawska L. A review of commuter exposure to ultrafine particles and its health effects. Atmos. Environ. 2011;45:2611–2622. doi: 10.1016/j.atmosenv.2011.02.065. - DOI
Publication types
MeSH terms
Substances
LinkOut - more resources
Full Text Sources
Other Literature Sources
Molecular Biology Databases

