. 2014 Jul;24(7):1053-63.
doi: 10.1101/gr.163659.113. Epub 2014 May 13.

Somatic retrotransposition in human cancer revealed by whole-genome and exome sequencing

Affiliations

Somatic retrotransposition in human cancer revealed by whole-genome and exome sequencing

Elena Helman et al. Genome Res. 2014 Jul.

Abstract

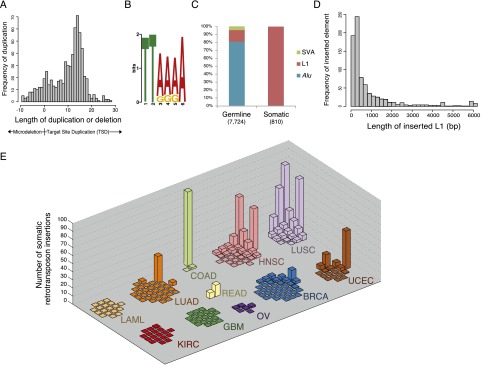
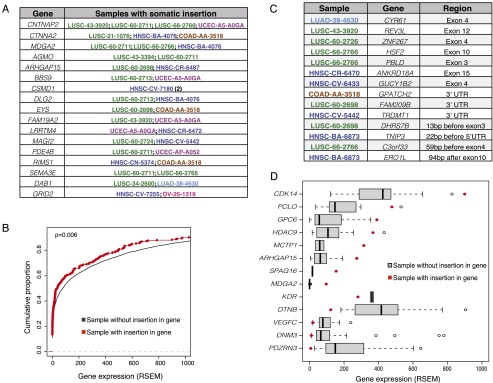
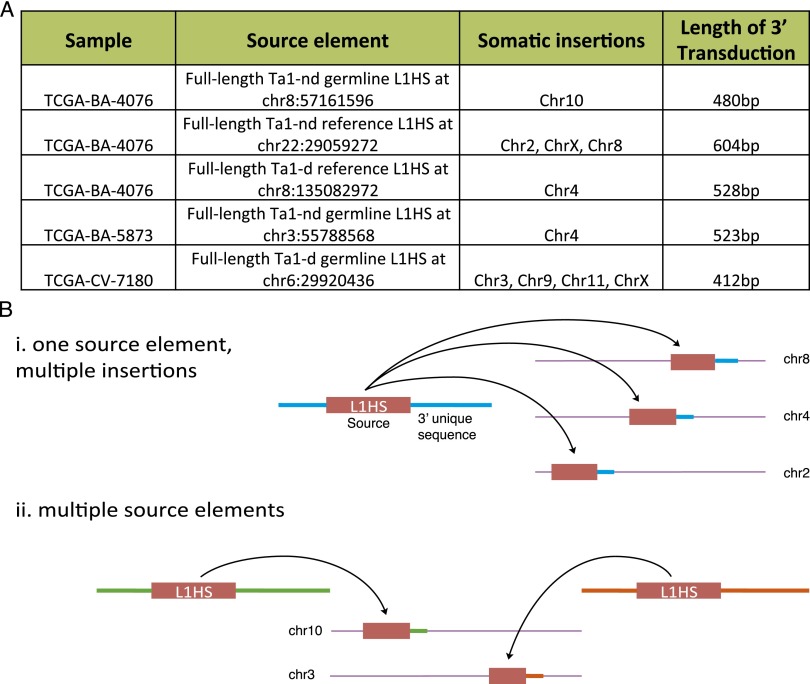
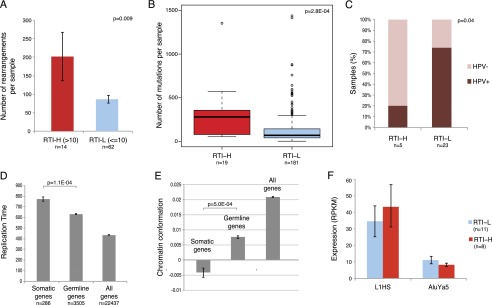
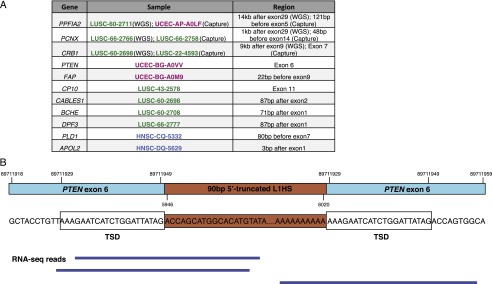
Retrotransposons constitute a major source of genetic variation, and somatic retrotransposon insertions have been reported in cancer. Here, we applied TranspoSeq, a computational framework that identifies retrotransposon insertions from sequencing data, to whole genomes from 200 tumor/normal pairs across 11 tumor types as part of The Cancer Genome Atlas (TCGA) Pan-Cancer Project. In addition to novel germline polymorphisms, we find 810 somatic retrotransposon insertions primarily in lung squamous, head and neck, colorectal, and endometrial carcinomas. Many somatic retrotransposon insertions occur in known cancer genes. We find that high somatic retrotransposition rates in tumors are associated with high rates of genomic rearrangement and somatic mutation. Finally, we developed TranspoSeq-Exome to interrogate an additional 767 tumor samples with hybrid-capture exome data and discovered 35 novel somatic retrotransposon insertions into exonic regions, including an insertion into an exon of the PTEN tumor suppressor gene. The results of this large-scale, comprehensive analysis of retrotransposon movement across tumor types suggest that somatic retrotransposon insertions may represent an important class of structural variation in cancer.


Figures

Figure 1.
Figure 1.
Landscape of retrotransposon insertions across cancer reveals a tumor-type specific pattern. (A) Distribution of duplication or deletion lengths at sites of somatic retrotransposon insertion. Target-site duplication (TSD) lengths are sequence duplications of positive length, while microdeletions at the breakpoint are plotted as negative values according to the length of the deletion. See Supplemental Figure 3A for an analogous plot of germline retrotransposon insertions. (B) A sequence logo of the consensus motif at the predicted breakpoints of somatic retrotransposon insertions. See Supplemental Figure 3B for germline insertion sequence motif. (C) Percentage of each retrotransposon family inserted in both tumor and matched normal (germline) and only in tumor (somatic) across all samples. (D) Length of somatically inserted L1 element (see Supplemental Fig. 3C for germline). (E) Distribution of somatic retrotransposon insertion events per individual across all tumor types. For each tumor type, the vertical axis displays the number of somatic retrotransposon events identified within each individual queried. These data are whole-genome sequences from 200 individuals collected and sequenced through The Cancer Genome Atlas, across 11 tumor types: lung adenocarcinoma (LUAD), lung squamous cell carcinoma (LUSC), ovarian carcinoma (OV), rectal adenocarcinoma (READ), colon adenocarcinoma (COAD), kidney clear cell carcinoma (KIRC), uterine corpus endometrioid carcinoma (UCEC), head and neck squamous cell carcinoma (HNSC), breast carcinoma (BRCA), acute myeloid leukemia (LAML), and glioblastoma multiforme (GBM). See Supplemental Figure 4, A and B, for other representations of these data.
Figure 2.
Figure 2.
Retrotransposons can mobilize into genic regions. (A) Genes that contain somatic retrotransposon insertions in more than one sample. (B) Empirical cumulative distribution function (ecdf) of gene expression, quantified by RNA-seq by Expectation Maximization (RSEM) values, of genes that contain somatic retrotransposon insertions in a specific sample (red) versus the ecdf of gene expression in genes that do not contain retrotransposon insertions across all other samples (black). (C) Genes that contain somatic retrotransposon insertions in or within 200 bp of exons, 5′, and 3′ UTRs. (D) Gene expression of a selection of genes with somatic retrotransposon insertions; the red dot shows the RSEM value in the particular tumor sample that contained the retrotransposon insertion in that gene, while the gray represents the gene’s expression across all other samples within that tumor type that do not contain a retrotransposon insertion.
Figure 3.
Figure 3.
3′-transductions elucidate source retrotransposon element. (A) Select 3′-transduction events, including the sample, the source element location (i.e., genomic origin of the unique sequence), the transposition insertion location, and the length of the transduced sequence. See Supplemental Table 4 for a full list. (B) Schematic of the two models of somatic retrotransposition detected seen in this analysis: (i) one source L1HS element becoming active and inserting multiple times across the tumor sample, and (ii) several source elements becoming active in the tumor sample.
Figure 4.
Figure 4.
Retrotransposon load is correlated with genomic instability, late-replication, and closed chromatin. (A) Number of somatic rearrangements in LUSC, LUAD, and HNSC samples with high retrotransposon load (>10 somatic retrotransposon insertions, RTI-H) and with low retrotransposon load (≤10 somatic insertion, RTI-L). (B) Number of somatic mutations in RTI-H and RTI-L samples across all 11 tumor types. (C) HPV status of RTI-H and RTI-L HNSC samples. (D) Replication timing of genes that contain somatic retrotransposon insertions versus genes that contain germline insertions, and all RefSeq genes. Later replicating genes have higher values of replication time on the y-axis. (E) Chromatin conformation of genes that contain somatic retrotransposon insertions versus genes that contain germline insertions, and all RefSeq genes. The y-scale represents relative chromatin “openness,” the lower the y-value, the more closed the chromatin state. (F) Expression (RPKM) of consensus L1HS and AluYa5 sequences in RTI-H and RTI-L LUSC samples. All error bars represent standard error of the distribution.
Figure 5.
Figure 5.
Exome sequencing identifies novel retrotransposon insertions into exons. (A) Genes with somatic retrotransposon insertions into exons as detected by TranspoSeq-Exome. Somatic insertions in PPFIA2, PCNX, and CRB1 were identified in the whole-genome sequencing cohort as well as in separate samples in the exome sequencing set. (B) Diagram of a 90-bp 5′-truncated L1HS element inserted into exon 6 of PTEN. In dark blue are RNA-seq reads that span the reference–transposon junction, supporting its expression.

References

    1. Bailey TL, Boden M, Buske FA, Frith M, Grant CE, Clementi L, Ren J, Li WW, Noble WS 2009. MEME SUITE: tools for motif discovery and searching. Nucleic Acids Res 37: W202–W208 - PMC - PubMed
    1. Banerji S, Cibulskis K, Rangel-Escareno C, Brown KK, Carter SL, Frederick AM, Lawrence MS, Sivachenko AY, Sougnez C, Zou L, et al. 2012. Sequence analysis of mutations and translocations across breast cancer subtypes. Nature 486: 405–409 - PMC - PubMed
    1. Bass AJ, Lawrence MS, Brace LE, Ramos AH, Drier Y, Cibulskis K, Sougnez C, Voet D, Saksena G, Sivachenko A, et al. 2011. Genomic sequencing of colorectal adenocarcinomas identifies a recurrent VTI1A-TCF7L2 fusion. Nat Genet 43: 964–968 - PMC - PubMed
    1. Beck CR, Collier P, Macfarlane C, Malig M, Kidd JM, Eichler EE, Badge RM, Moran JV 2010. LINE-1 retrotransposition activity in human genomes. Cell 141: 1159–1170 - PMC - PubMed
    1. Belgnaoui SM, Gosden RG, Semmes OJ, Haoudi A 2006. Human LINE-1 retrotransposon induces DNA damage and apoptosis in cancer cells. Cancer Cell Int 6: 13. - PMC - PubMed

Publication types