

Population genomics of parallel hybrid zones in the mimetic butterflies, H. melpomene and H. erato
- PMID: 24823669
- PMCID: PMC4120085
- DOI: 10.1101/gr.169292.113
Population genomics of parallel hybrid zones in the mimetic butterflies, H. melpomene and H. erato
Abstract
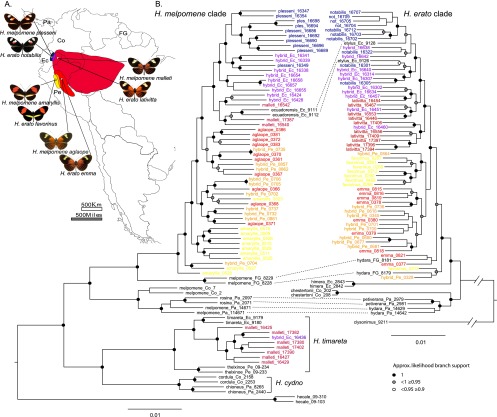
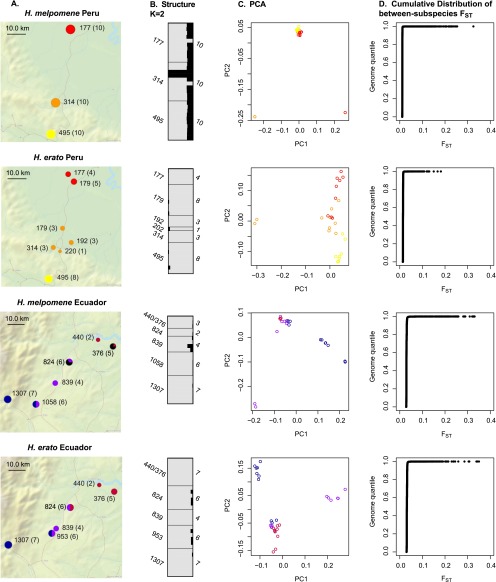
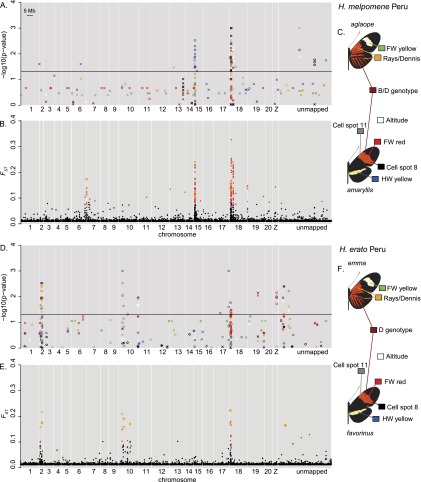
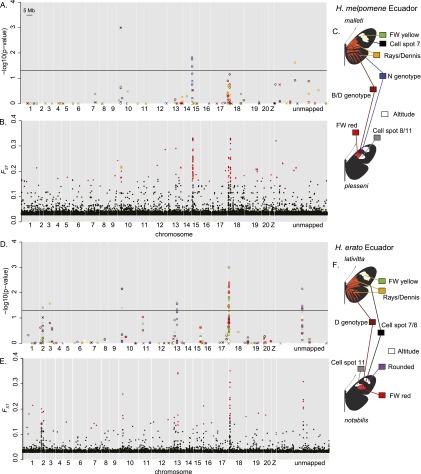
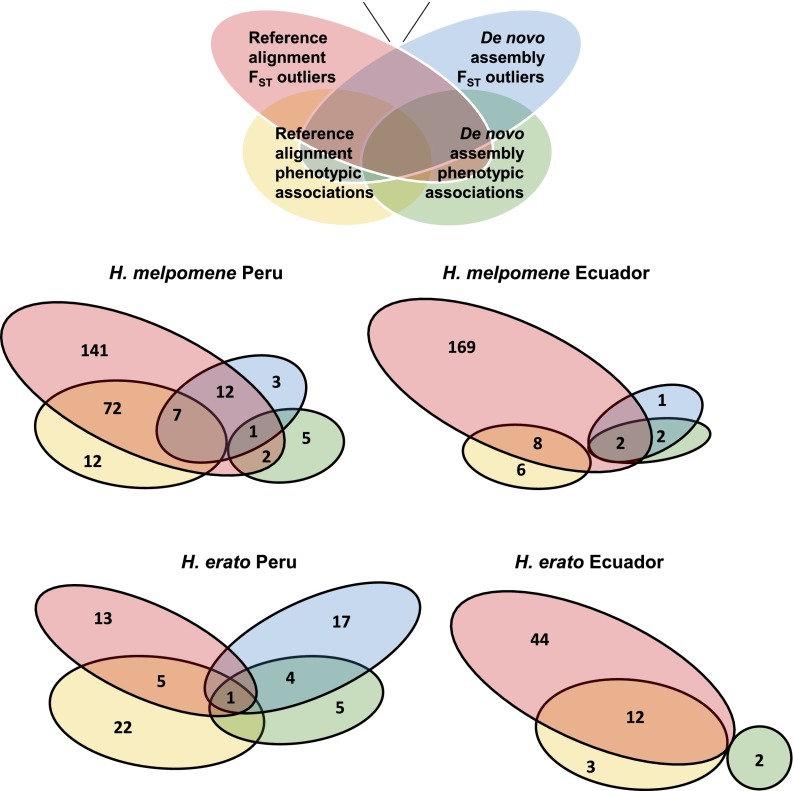
Hybrid zones can be valuable tools for studying evolution and identifying genomic regions responsible for adaptive divergence and underlying phenotypic variation. Hybrid zones between subspecies of Heliconius butterflies can be very narrow and are maintained by strong selection acting on color pattern. The comimetic species, H. erato and H. melpomene, have parallel hybrid zones in which both species undergo a change from one color pattern form to another. We use restriction-associated DNA sequencing to obtain several thousand genome-wide sequence markers and use these to analyze patterns of population divergence across two pairs of parallel hybrid zones in Peru and Ecuador. We compare two approaches for analysis of this type of data-alignment to a reference genome and de novo assembly-and find that alignment gives the best results for species both closely (H. melpomene) and distantly (H. erato, ∼15% divergent) related to the reference sequence. Our results confirm that the color pattern controlling loci account for the majority of divergent regions across the genome, but we also detect other divergent regions apparently unlinked to color pattern differences. We also use association mapping to identify previously unmapped color pattern loci, in particular the Ro locus. Finally, we identify a new cryptic population of H. timareta in Ecuador, which occurs at relatively low altitude and is mimetic with H. melpomene malleti.
© 2014 Nadeau et al.; Published by Cold Spring Harbor Laboratory Press.
Figures
Similar articles
-
Genomic architecture of adaptive color pattern divergence and convergence in Heliconius butterflies.Genome Res. 2013 Aug;23(8):1248-57. doi: 10.1101/gr.150615.112. Epub 2013 May 14. Genome Res. 2013. PMID: 23674305 Free PMC article.
-
Highly conserved gene order and numerous novel repetitive elements in genomic regions linked to wing pattern variation in Heliconius butterflies.BMC Genomics. 2008 Jul 22;9:345. doi: 10.1186/1471-2164-9-345. BMC Genomics. 2008. PMID: 18647405 Free PMC article.
-
Comparative population genetics of a mimicry locus among hybridizing Heliconius butterfly species.Heredity (Edinb). 2011 Sep;107(3):200-4. doi: 10.1038/hdy.2011.3. Epub 2011 Feb 9. Heredity (Edinb). 2011. PMID: 21304546 Free PMC article.
-
Introgression of wing pattern alleles and speciation via homoploid hybridization in Heliconius butterflies: a review of evidence from the genome.Proc Biol Sci. 2012 Dec 12;280(1752):20122302. doi: 10.1098/rspb.2012.2302. Print 2013 Feb 7. Proc Biol Sci. 2012. PMID: 23235702 Free PMC article. Review.
-
Heliconius butterflies: a window into the evolution and development of diversity.Curr Opin Genet Dev. 2021 Aug;69:72-81. doi: 10.1016/j.gde.2021.01.010. Epub 2021 Mar 11. Curr Opin Genet Dev. 2021. PMID: 33714874 Free PMC article. Review.
Cited by
-
Genomic evidence for gene flow between monarchs with divergent migratory phenotypes and flight performance.Mol Ecol. 2020 Jul;29(14):2567-2582. doi: 10.1111/mec.15508. Epub 2020 Jul 11. Mol Ecol. 2020. PMID: 32542770 Free PMC article.
-
Genetic diversification of Panstrongylus geniculatus (Reduviidae: Triatominae) in northern South America.PLoS One. 2019 Oct 17;14(10):e0223963. doi: 10.1371/journal.pone.0223963. eCollection 2019. PLoS One. 2019. PMID: 31622439 Free PMC article.
-
The genetic architecture of adaptation: convergence and pleiotropy in Heliconius wing pattern evolution.Heredity (Edinb). 2019 Aug;123(2):138-152. doi: 10.1038/s41437-018-0180-0. Epub 2019 Jan 22. Heredity (Edinb). 2019. PMID: 30670842 Free PMC article.
-
Urbanization drives adaptive evolution in a Neotropical bird.Curr Zool. 2022 Sep 6;69(5):607-619. doi: 10.1093/cz/zoac066. eCollection 2023 Oct. Curr Zool. 2022. PMID: 37637315 Free PMC article.
-
Complex modular architecture around a simple toolkit of wing pattern genes.Nat Ecol Evol. 2017;1(3):52. doi: 10.1038/s41559-016-0052. Epub 2017 Jan 30. Nat Ecol Evol. 2017. PMID: 28523290 Free PMC article.
References
-
- Altschul SF, Gish W, Miller W, Myers EW, Lipman DJ. 1990. Basic local alignment search tool. J Mol Biol 215: 403–410 - PubMed
-
- Aulchenko YS, Ripke S, Isaacs A, van Duijn CM. 2007. GenABEL: an R library for genome-wide association analysis. Bioinformatics 23: 1294–1296 - PubMed
-
- Avidor-Reiss T, Maer AM, Koundakjian E, Polyanovsky A, Keil T, Subramaniam S, Zuker CS. 2004. Decoding cilia function: defining specialized genes required for compartmentalized cilia biogenesis. Cell 117: 527–539 - PubMed
-
- Barton NH, Hewitt GM. 1985. Analysis of hybrid zones. Annu Rev Ecol Syst 16: 113–148
Publication types
MeSH terms
Grants and funding
LinkOut - more resources
Full Text Sources
Other Literature Sources
Research Materials