. 2014 May 13;12(5):e1001861.
doi: 10.1371/journal.pbio.1001861. eCollection 2014 May.

The kinase regulator mob1 acts as a patterning protein for stentor morphogenesis

Affiliations

The kinase regulator mob1 acts as a patterning protein for stentor morphogenesis

Mark M Slabodnick et al. PLoS Biol. .

Abstract

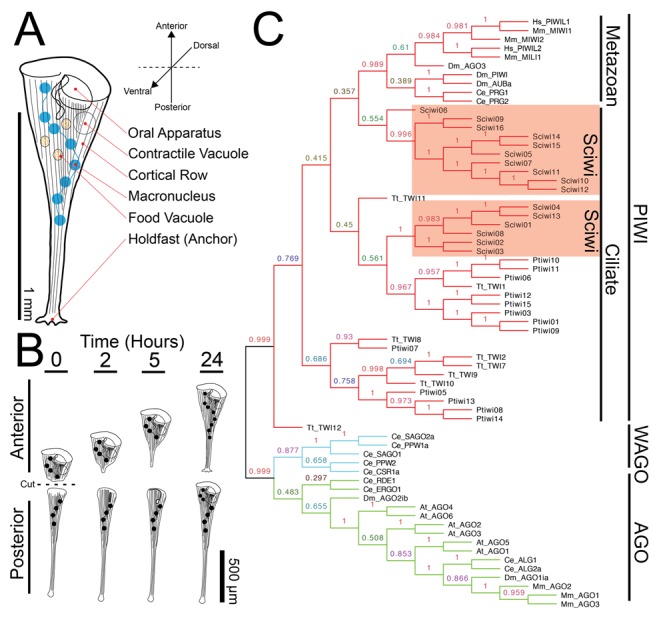
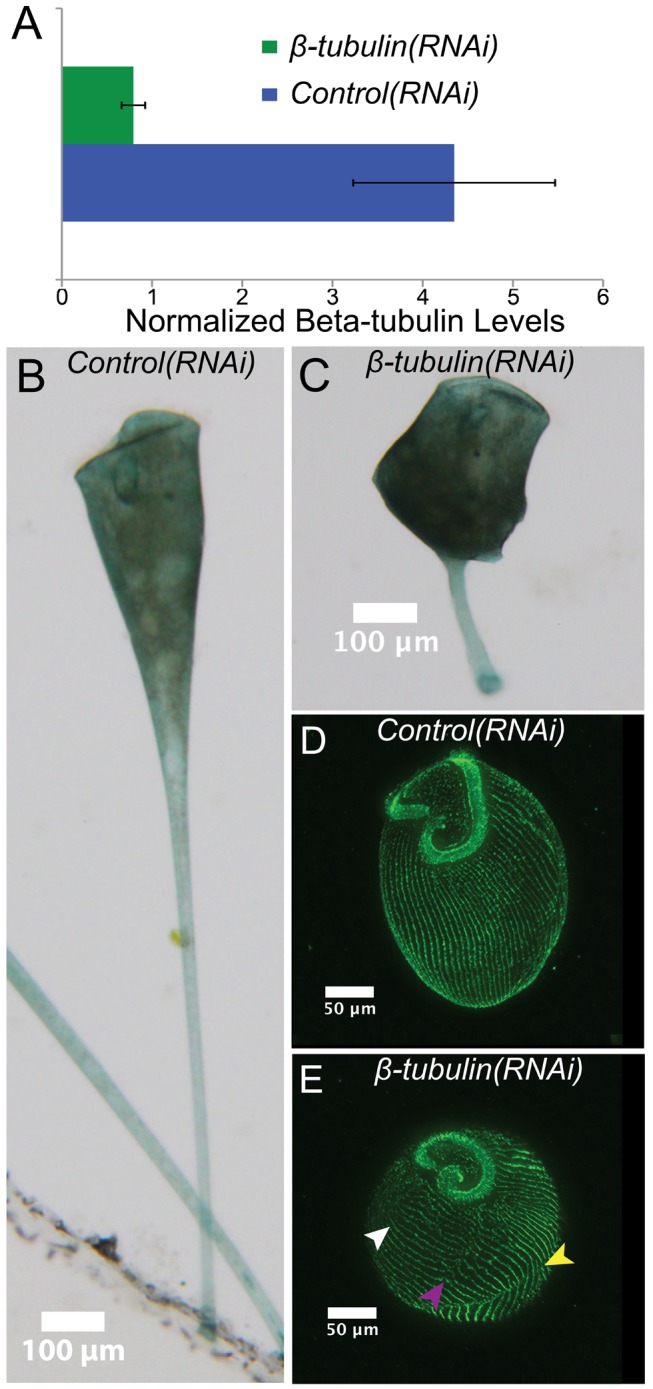
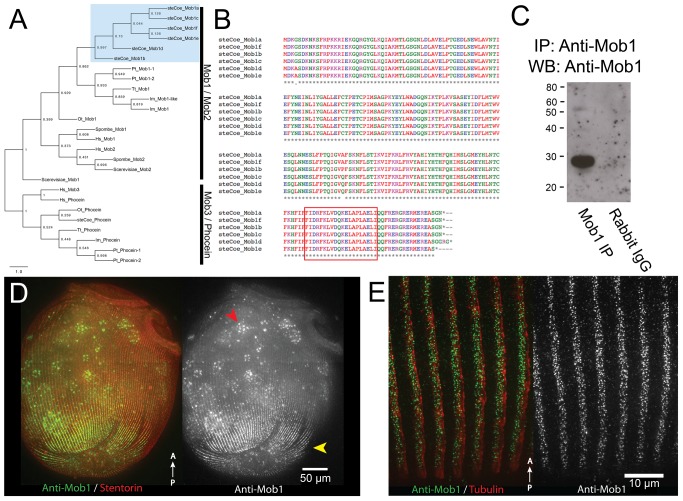
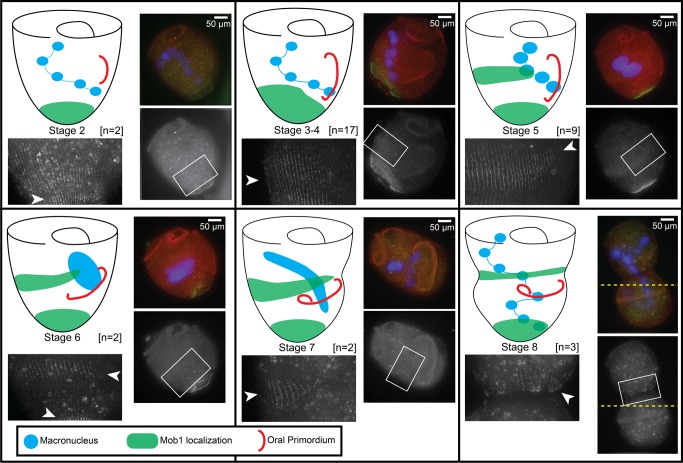
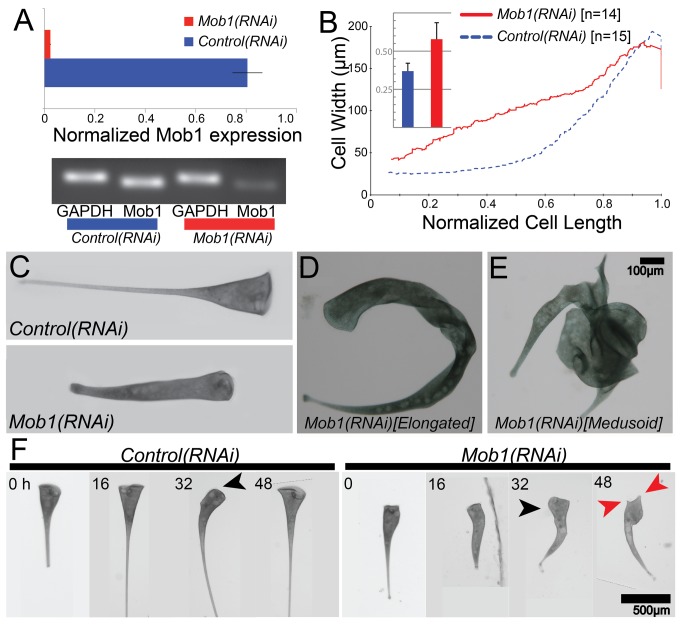
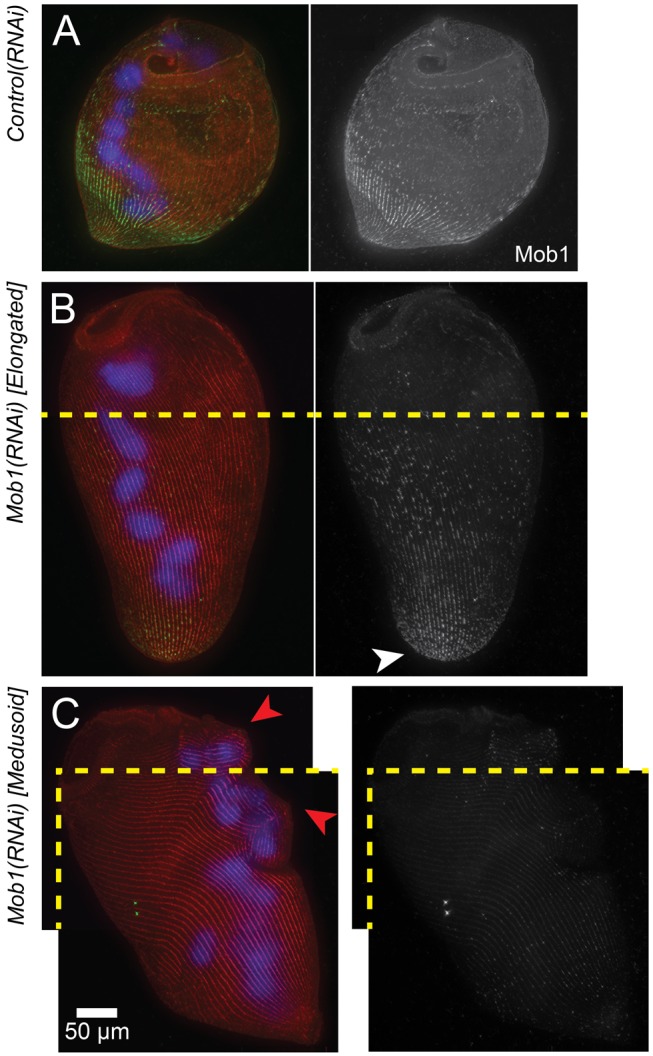
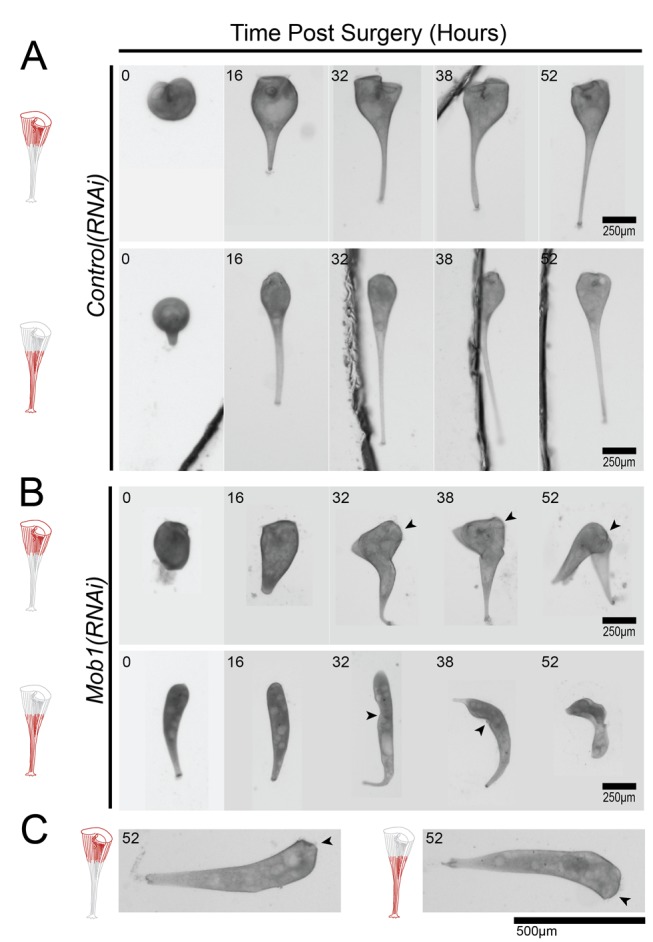
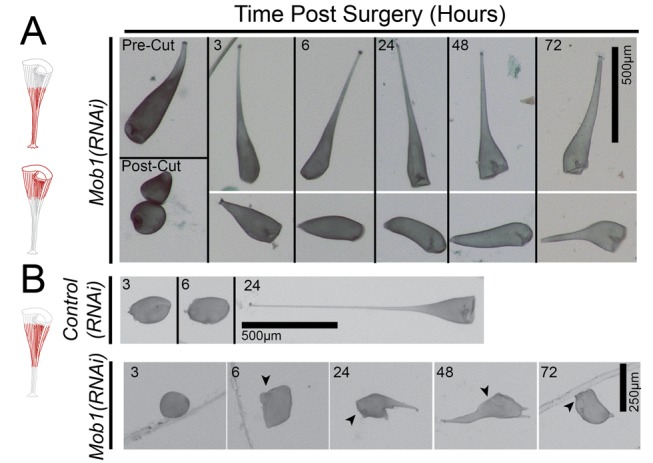
Morphogenesis and pattern formation are vital processes in any organism, whether unicellular or multicellular. But in contrast to the developmental biology of plants and animals, the principles of morphogenesis and pattern formation in single cells remain largely unknown. Although all cells develop patterns, they are most obvious in ciliates; hence, we have turned to a classical unicellular model system, the giant ciliate Stentor coeruleus. Here we show that the RNA interference (RNAi) machinery is conserved in Stentor. Using RNAi, we identify the kinase coactivator Mob1--with conserved functions in cell division and morphogenesis from plants to humans-as an asymmetrically localized patterning protein required for global patterning during development and regeneration in Stentor. Our studies reopen the door for Stentor as a model regeneration system.


Conflict of interest statement

The authors have declared that no competing interests exist.

Figures

Figure 1
Figure 1. The anatomy of Stentor coeruleus.
(A) Cartoon of Stentor coeruleus highlighting key cellular structures, all of which have reproducible positions within the cell. (B) Cartoon representing Stentor regeneration after surgical bisection as initially reported by Thomas Hunt Morgan in 1901. (C) A neighbor-joining phylogenetic analysis of protein sequences of Stentor argonaute homologs along with sequences from Paramecium (Pt), Tetrahymena (Tt), human (Hs), mouse (Mm), C. elegans (Ce), Drosophila (Dm), and Arabidopsis (At). The three major classes of Argonaute proteins—PIWI, WAGO, and AGO—are indicated (Sciwi proteins listed in Table S1, gene IDs in Table S2).
Figure 2
Figure 2. β-tubulin(RNAi) results in aberrant cell morphologies.
(A) qRT-PCR results showing relative expression of β-tubulin normalized to GAPDH expression in both control(RNAi) and β-tubulin(RNAi) cells. (B, C) Brightfield images of control and β-tubulin(RNAi) cells showing dramatic alteration in cell shape. (D, E) Immunofluorescence images of stained control and β-tubulin(RNAi) cells highlighting cortical microtubule bundles (green, anti-α-tubulin). In contrast to the highly organized parallel microtubule rows seen in control cells, β-tubulin(RNAi) cells have improperly oriented (white arrow), broken (purple arrow), and discontinuous (yellow arrow) rows, indicating a disruption of normal cellular patterning.
Figure 3
Figure 3. Conservation of Mob1 and its localization in Stentor.
(A) Maximum-likelihood phylogenetic tree showing Stentor Mob1's position relative to other MOB family sequences from Human (Hs), S. cerevisiae, S. pombe (Sp), Tetrahymena (Tt), Paramecium (Pt), Ichthyophthirius (Im), and Oxytricha (Ot). Cluster of Stentor sequences is indicated with a blue box. (B) Alignment of Stentor coeruleus Mob1 protein sequences. The peptide sequence used to generate the Mob1 antibody is indicated by the boxed region near the C terminus. (C) IP:Western blot showing the Mob1 band present at 26 kD. Rabbit IgG alone was run to gauge the level of background signal generated by the secondary antibody to rule out the contaminating signal from IgG light-chain, which is around the same size as Mob1. (D) Immunofluorescence image of cells showing Mob1 localization (green, anti-Mob1) and cortical rows (red, stentorin-autofluorescence). Mob1 localizes to the OA in the anterior and cortical rows of the posterior (yellow arrow). There is background signal from autofluorescent food vacuoles containing Chlamydomonas (red arrow). (E) Immunofluorescence image showing a high magnification view of Mob1 localization (green, anti-Mob1) at the posterior, which is punctate and diffusely labels the cortical rows marked by the tubulin staining (red, anti-acetylated tubulin).
Figure 4
Figure 4. Mob1 localizes to the presumptive posterior during cell division.
Cartoon showing Mob1 localization next to representative immunofluorescence images for each stage of division. Regions indicated by the white boxes are magnified in the adjacent images to clearly show Mob1 localization. Number of cells observed at each stage: stage 2 (n = 2), stages 3–4 (n = 17), stage 5 (n = 9), stage 6 (n = 2), stage 7 (n = 2), and stage 8 (n = 3) are represented, with staining in all cells consistent with the diagram. Mob1 appears to migrate up from the posterior during stages 3–4 and focuses into a band around the midline in stage 5. Through the end of division, this band is maintained and forms a clear border between the two daughter cells, which later becomes the posterior end of the anterior daughter cell. High levels of background autofluorescence from Chlamydomonas containing food vacuoles is often a problem because cells were fed continuously for this experiment, but Mob1 staining can be seen specifically along cortical rows indicated by white arrowheads. The cells imaged in stage 7 were too large to fit in a single frame, and two separate images were taken with identical settings, then manually stitched together using the cortical rows for alignment (join-point of the two images is indicated by a dashed yellow line).
Figure 5
Figure 5. Mob1(RNAi) cells lose proper cell proportions and body axes.
(A) qRT-PCR data showing relative expression of Mob1 normalized to GAPDH expression in control and Mob1(RNAi) cells. (B) Quantitative analysis of the proportionality defect plotted as a graph of cell width versus normalized cell length for control(RNAi) (blue, n = 14) and Mob1(RNAi) (red, n = 15) cells. Data for each line represent a moving average of all samples with a window size of 2n. These measurements were used to compute a shape factor as described in Materials and Methods and graphed in the inset bar graph. The shape factor describes deviation from a shape having perfect straight lines on the cell edge. Data in the inset show an increase in shape factor from 0.37±0.052 (n = 15) in control cells to 0.58±0.108 (n = 14) in Mob1(RNAi) cells, a highly significant increase (p = 1.8×10⁻⁶). (C) Control cell's canonical shape as compared to a Mob1(RNAi) cell fed the RNAi vector for 3 d, showing altered cell proportionality. (D, E) Brightfield image of an elongated (D) and medusoid (E) cell. (F) Selected images from a time course. Control(RNAi) and Mob1(RNAi) cells were isolated after 2 d of feeding and imaged every 2 h for an additional 52 h. Spontaneous reorganization of the OA (black arrows) occurred prior to the multipolar phenotype (red arrows) in Mob1(RNAi) cells.
Figure 6
Figure 6. Presence of residual Mob1 protein in Mob1(RNAi) cells.
(A) Immunofluorescence images of stained control(RNAi) cells showing Mob1 localization (green, anti-Mob1), macronucleus (blue, DAPI), and cortical rows (red, stentorin-autofluorescence). (B, C) Immunofluorescence images of stained elongated (B) and medusoid (C) Mob1(RNAi) cells; Mob1 (green, anti-Mob1), macronucleus (blue, DAPI), and cortical rows (red, stentorin autofluorescence) (compare to A). Cortical aberrations are seen in the cortical rows (red arrows). Both the elongated and medusoid cells were too large to fit in a single frame, and two separate images were taken with identical settings, then manually stitched together using the cortical rows for alignment (join-lines between images are indicated by a dashed yellow line).
Figure 7
Figure 7. Morgan revisited: regeneration of proportionate structures in Stentor requires Mob1 protein.
(A–C) Observed fragments of cells are shown in red, and OAs are indicated with black arrowheads where they are difficult to identify. (A) Regeneration of both anterior and posterior fragments of control cells after surgical bisection. (B) Regeneration of both anterior and posterior fragments of bisected Mob1(RNAi) cells after 3 d of feeding on the RNAi vector. (C) Anterior and posterior Mob1(RNAi) cell fragments regenerated OA/holdfast properly in 10% of cells but failed to reestablish normal cell proportions (n = 20).
Figure 8
Figure 8. Residual Mob1 in the anterior and posterior can be surgically removed.
(A, B) Observed fragments of cells are shown in red, and OAs are indicated with black arrowheads where they are difficult to identify. (A) Mob1(RNAi) cells that are bisected only 2 d after feeding the RNAi vector are capable of normal regeneration. (B) Control(RNAi) and Mob1(RNAi) cells had their anterior and posterior regions excised to remove regions of the cell where Mob1 localizes. Only removal of both Mob1-containing poles in Mob1(RNAi) cells prevented regeneration at this early stage of the RNAi time course.

Comment in

References

    1. Kirschner M, Gerhart J, Mitchison T (2000) Molecular “vitalism” review. Cell 100: 79–88. - PubMed
    1. Shulman J, St Johnston D (1999) Pattern formation in single cells. Trends Cell Biol 15: M60–M64. - PubMed
    1. Trembley A (1744) Translation of a letter from Mr. Abraham Trembley, F. R. S. to the President, with observations upon several newly discover'd species of fresh-water polypi. Philos Trans R Soc Lond B Biol Sci 43: 169–183 10.1098/rstl.1744.0040 - DOI
    1. Tartar V (1961) The biology of stentor. New York: Pergamon Press. 434 pp.
    1. Morgan T (1901) Regeneration of proportionate structures in Stentor. Biol Bull 2: 311.

Publication types

MeSH terms

Substances